Hello, Quarto !
I have finally built my website using Quarto. Currently, the page is hosted via GitHub Pages.
How it all started
My encounter with Statistics was rather accidental. The first time I sat for the Panhellenic exams, I was admitted to the Department of Economics at the University of Peloponnese. Although I liked the idea of studying Economics, the prospect of relocating to another city (Tripoli) posed an enormous financial burden accompanied by great uncertainty, something I simply couldn’t afford. So, I chose to retake the Panhellenic exams the very next year. From what I remember, I had listed Economics and Computer Science departments first, followed by Statistics departments, prioritising those in the Attica region and then the rest of Greece. In the end, when the admission scores were announced, I found out I had been admitted to the Department of Statistics and Insurance Science at the University of Piraeus. Being, then, a student in a Statistics department, I began gaining my first relevant exposure through the university. During the first years of my studies I focused on theory in the fields of Statistics, Probability, Insurance, and Actuarial Science. This gave me a solid theoretical foundation. However, I was missing the most important trait for a Statistician: the ability to put my knowledge into practice and apply the corresponding statistical techniques in real-world settings. The university placed very little emphasis on this aspect. To illustrate, my year’s curriculum included only two courses on applied statistics using statistical software, namely Excel and SPSS. The SPSS course was decent, but it was by no means commensurate with the knowledge I had acquired, nor did it meet the modern demands of the job market. On top of that, SPSS as a piece of software has significant drawbacks that make it a poor choice, including the inability to customise your model, the lack of transparency in how results are produced, and of course its cost. During 2018-2019 I started looking for alternatives, as I absolutely loathed the software, or, to be more precise, the fact that I would have to pay for it. Among other things, I found free alternatives that followed the same logic as SPSS, such as PSPP, JASP, and jamovi. Personally, I consider the latter two to be perfectly respectable for simple analyses. In fact, I would recommend JASP and jamovi to anyone as a worthy alternative if they lacked programming skills and had no access to SPSS. It was around that time that I discovered there is a programming language focused on data analysis, R (also known by the hashtag #rstats).
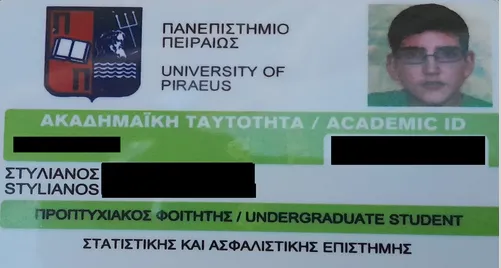 My student ID from the Statistics department in Piraeus. I may no longer look like the kid in the photo, but this is indeed my ID. The kid in that picture doesn’t know it yet, but some serious storms are heading his way in a few years, though things will get better (hopefully).
From SPSS to R
Our university, like many universities around the world, offers its students free licences for various software. The problem is that the subscription expires as soon as you graduate.
Transitioning from a statistical suite to a programming language can be a traumatic experience, especially if it’s your first programming language. SPSS and its free alternatives accompanied me for a respectable period of time; however, the very defining strength of these applications gradually began turning into a weakness. These programs are designed so that individuals with basic knowledge and understanding of Statistics can carry out their own analyses. As I progressed through my studies, I kept learning more methodologies and techniques, until at some point I realised that these “ready-made” tools could only take me so far. They are undoubtedly useful, but they impose a ceiling on how deeply the user needs, or is allowed, to think. For anything beyond that ceiling, they either ignore it entirely because it’s considered too complex for the majority, or they adopt reasonable assumptions based on the data so that the average user doesn’t have to deal with theory or hypothesis testing. Where exactly that ceiling lies varies from application to application: some choose to be extremely simple and do a few things well for the everyday user (e.g., Excel), while others offer more options with greater complexity (e.g., SPSS, JASP, Weka). All of them, however, have their own limitations. As I worked with such software, I kept wondering what I would do if I wanted to set different parameters or apply a variation of a test I had read about in a recently published paper. That’s when I realised that, by continuing down this path, I would end up serving the software rather than my own purpose. My goal was clearly to master my Science, not a program or a statistical software suite. So, I decided to make the big switch.
First steps
My relationship with R began in 2018, with quite a few ups and downs. I can say that at first it felt peculiar, and for the most part I used it almost mechanically. In short, I was copying code and simply trying to understand what I was doing. To expose myself even further: if I wanted to check whether differences were statistically significant, I would Google it. Due to its idiosyncrasies as a language, I used it more as an analysis tool than as a programming language. My first uses of R involved some basic statistical tests, and I was impressed that I could now use a tool with theoretically unlimited capabilities compared to the “ready-made” programs. The whole journey, of course, was particularly interesting and involved many late nights. Despite all that, after countless error messages, I started to notice my gradual improvement. And I still hadn’t grasped what a good decision I had made, as I was unaware of the full extent of its capabilities. Over time, I discovered that you could create your own plots with the {ggplot2} package, and I was thrilled (admittedly a bit more than normal) when I learned that the BBC and the Financial Times use {ggplot2} to produce their impressive graphics. I then learned about other capabilities as well, the most notable being the creation of web applications and dashboards with the {Shiny} package, where the range of possibilities extended well beyond Statistics. Around the same time, I discovered Kaggle, a website dedicated to data science. I found it to be an incredibly useful platform, and that’s where I started publishing various notebook-articles, charts, and generally experimenting with R. Looking back today, after several years, my charts were abysmal, but back then I would look at them and feel proud. At least over time I improved, and I now have the self-awareness to admit that they were indeed terrible 😀. If you ask nicely, I might even upload one or two so you can see how clueless I was back then and we can all have a good laugh. Kaggle was extremely valuable. I learned a tremendous amount, and there were people working at major corporations who published solutions to real-world problems. To this day, competitions are posted and many share their solutions. The only problem is that Python gradually took over, and as a result the vast majority of content now covers only Python. This caused the R user community to shrink, with fewer and fewer R articles being published or being replaced by Python equivalents. Because of that, I made an interesting decision…
 The R language is a programming language that specializes in data analysis and statistics. It was created in 1993 by Ross Ihaka and Robert Gentleman.
Out of platform
A few years ago I decided to build my own website so I could host my articles myself. First, I had to decide how to create it. There were many options, and I experimented with various approaches and tools. One solution would have been a conventional website built with WordPress, but that would have been costly since I would need to host it on a server and cover the associated expenses (roughly $10/month) for a decent and secure VPS plan. That wasn’t worth it. Being the cheapskate that I am, I looked for a more affordable way, and as it turns out, there is one. During that period I discovered static websites and the fact that a blog doesn’t actually need a server. Examples include Hugo with the help of the {blogdown} package and {distill}, which were decent solutions but came with significant issues. On the one hand, Hugo is built on a language I don’t know (Go), so if I wanted to make changes or add new functionality it would have been impossible. Moreover, my previous site, built with Distill, wasn’t mobile-friendly (non-responsive), as it would hide the menu button on small screens. Quarto solved many of the problems these two approaches had, and nowadays a great many people use it for their websites. Yes, Quarto still has some shortcomings compared to other established site-building frameworks (e.g., Astro), but right now it’s the best option for anyone working in analysis languages (R, Python, Julia) who wants to publish articles based on their work. Its main advantage, in my opinion, is the ability to execute an analysis file and export it directly as an article. If I were using another static site builder like Astro, I would have to run my code separately each time, paste the results or charts into the site, and rebuild, which would make the whole process unproductive.

Website goals
Since this is my first article on the website, I’d like to lay out my goals for it. So, here’s what I plan to do:
- Write articles and carry out machine learning analyses (using R and Python)
- Publish explanatory articles (e.g., “How to make your Quarto site” etc.)
- Showcase my activities / projects (mainly my
{Shiny}applications, etc.) - Publish material and articles in Greek, since there isn’t a large audience in Greece and I want that to change
- Solve exam papers, or at least similar exercises, using R
- And much more …, so stay tuned!
Acknowledgments
Image by R. E. Beck from Pixabay