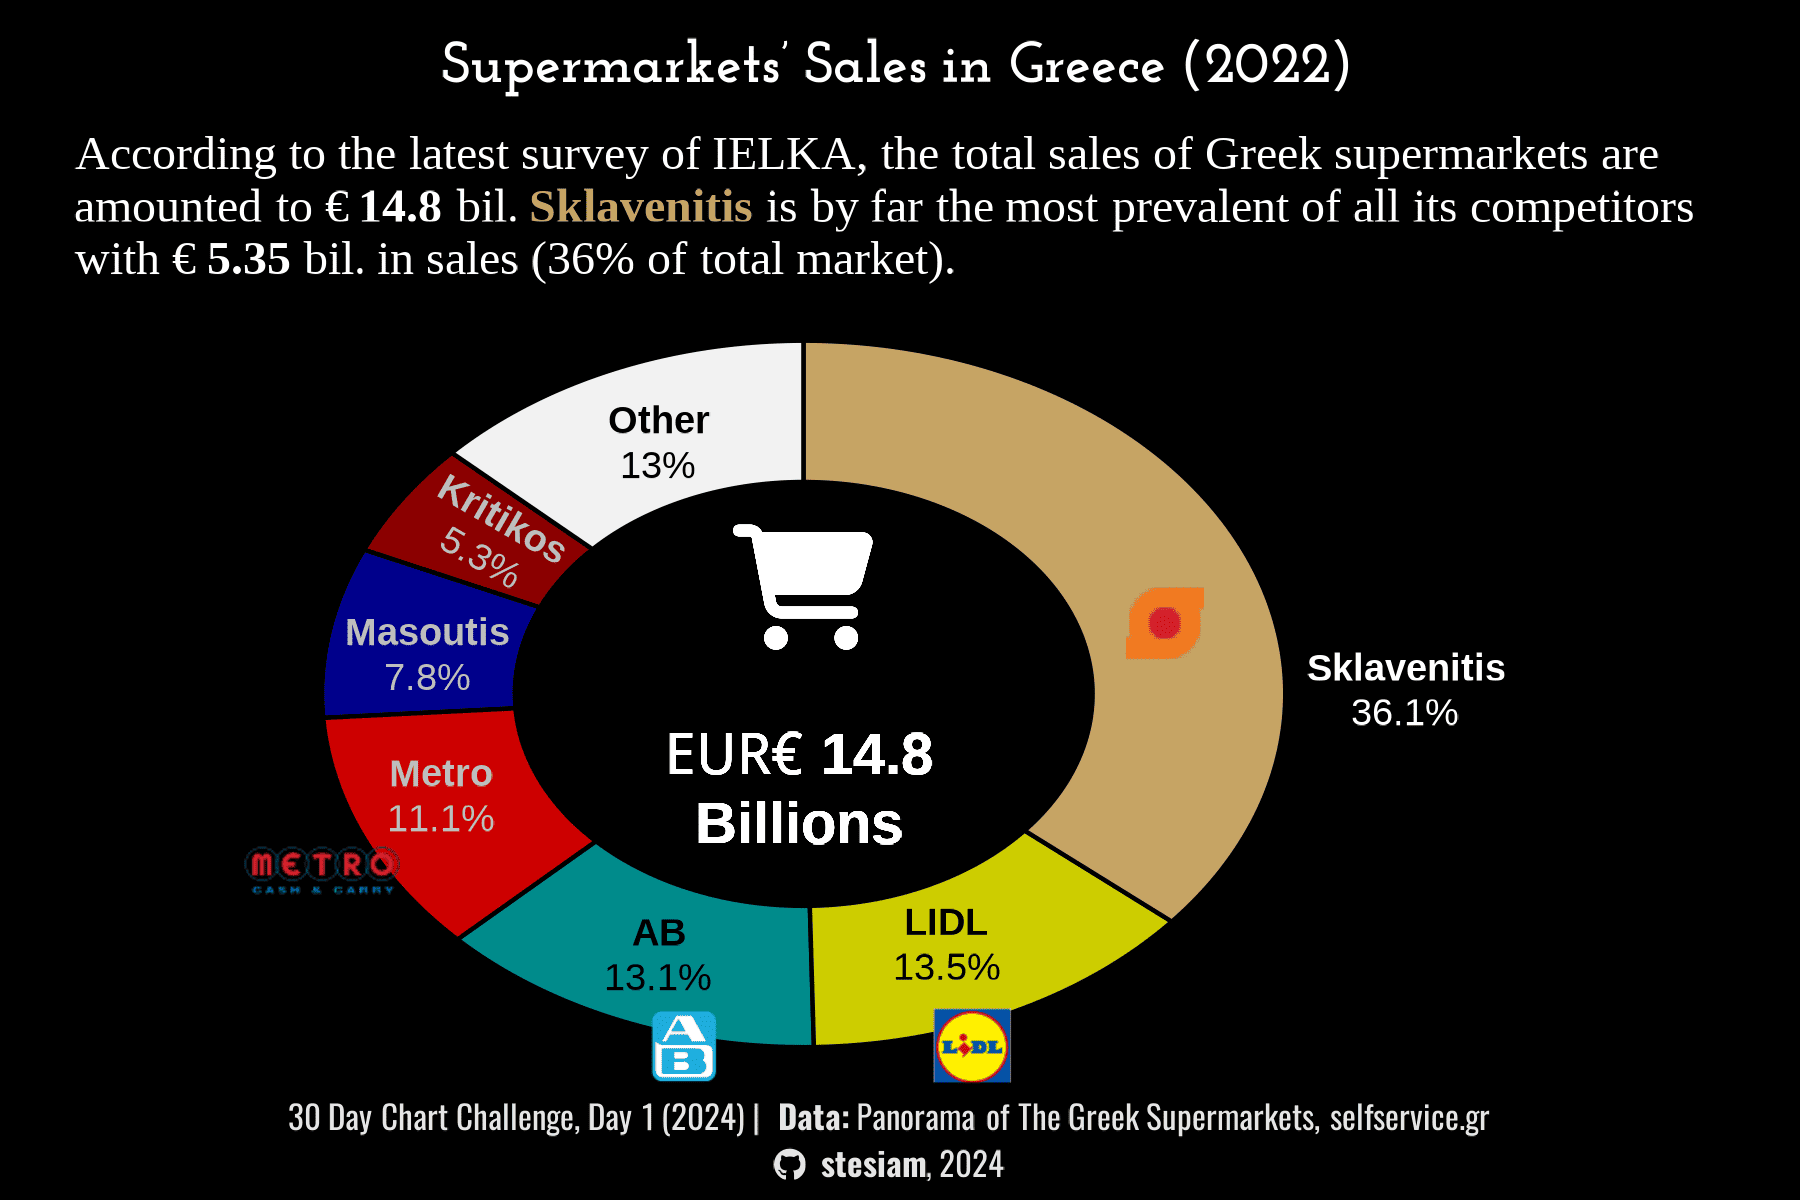
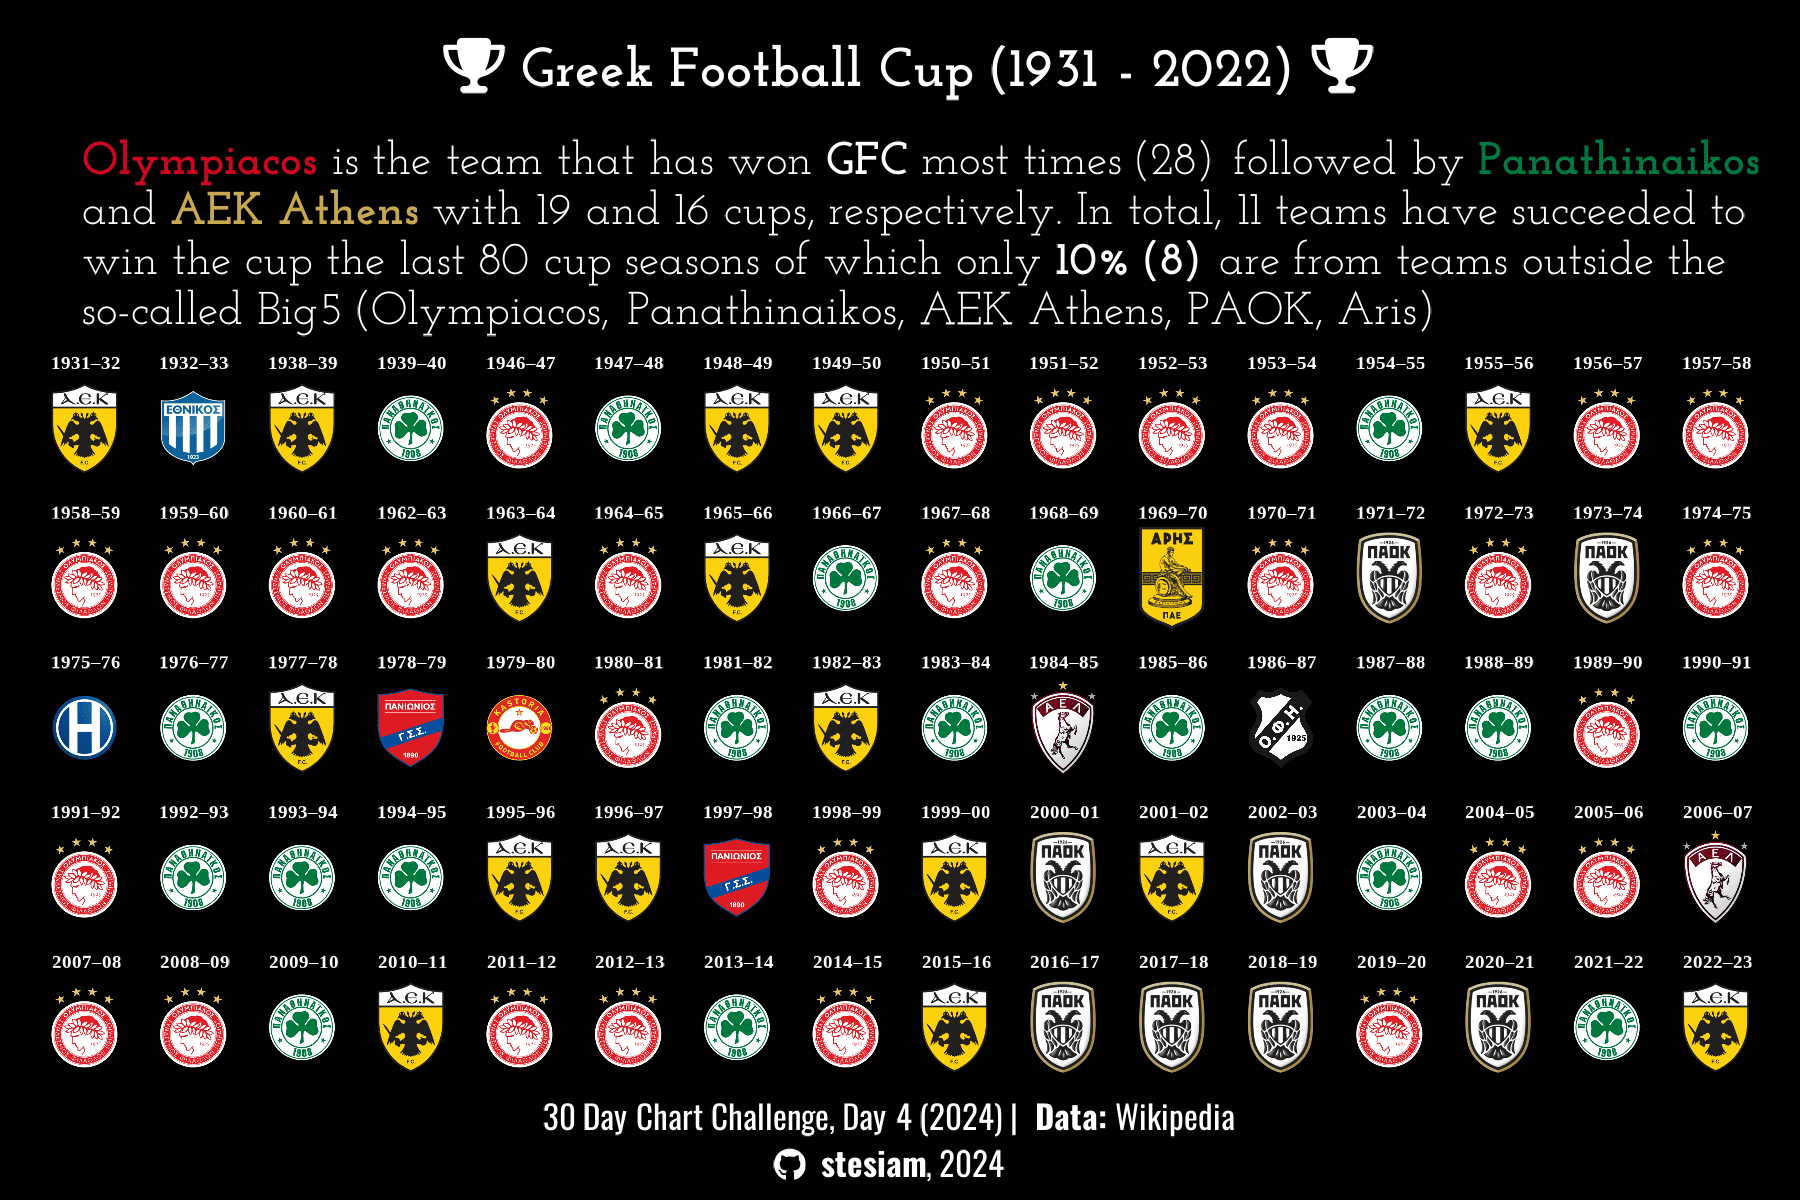
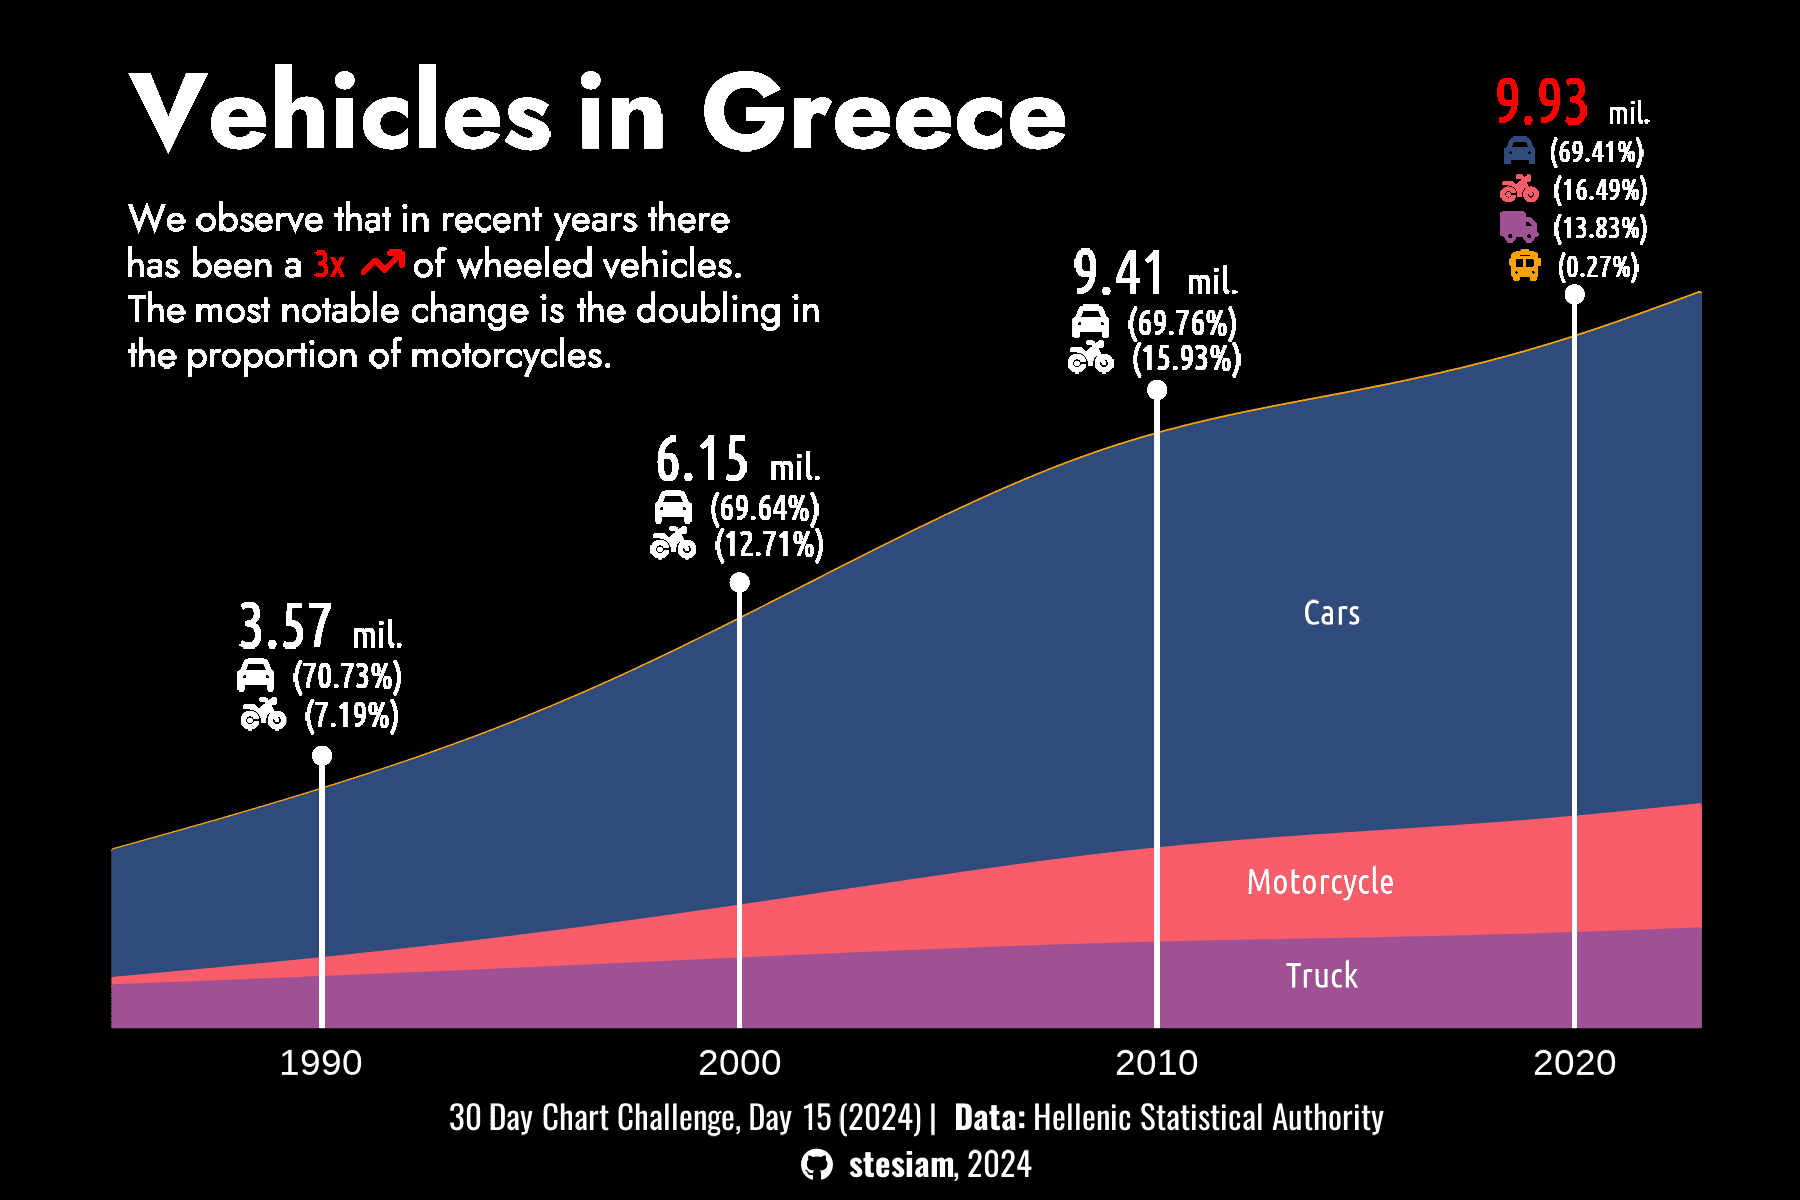
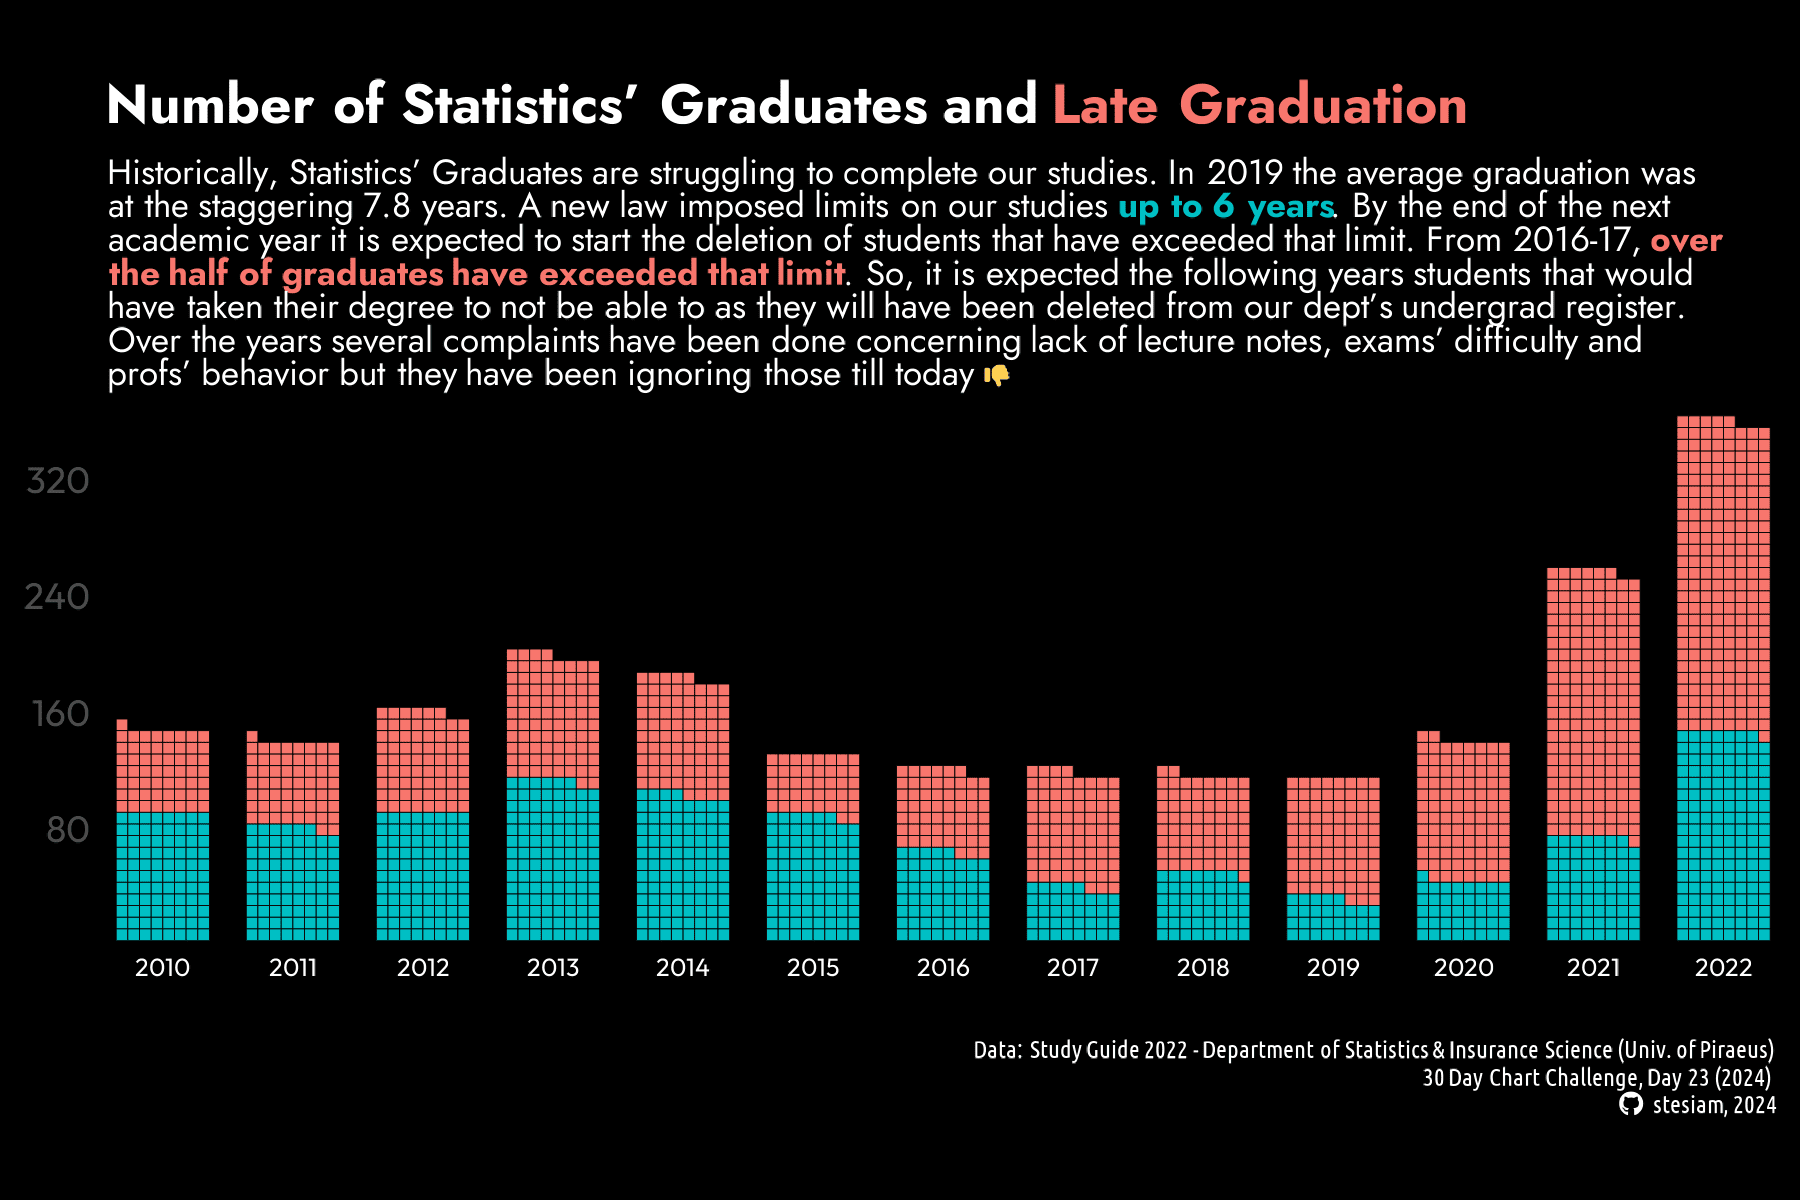
Interactive charts
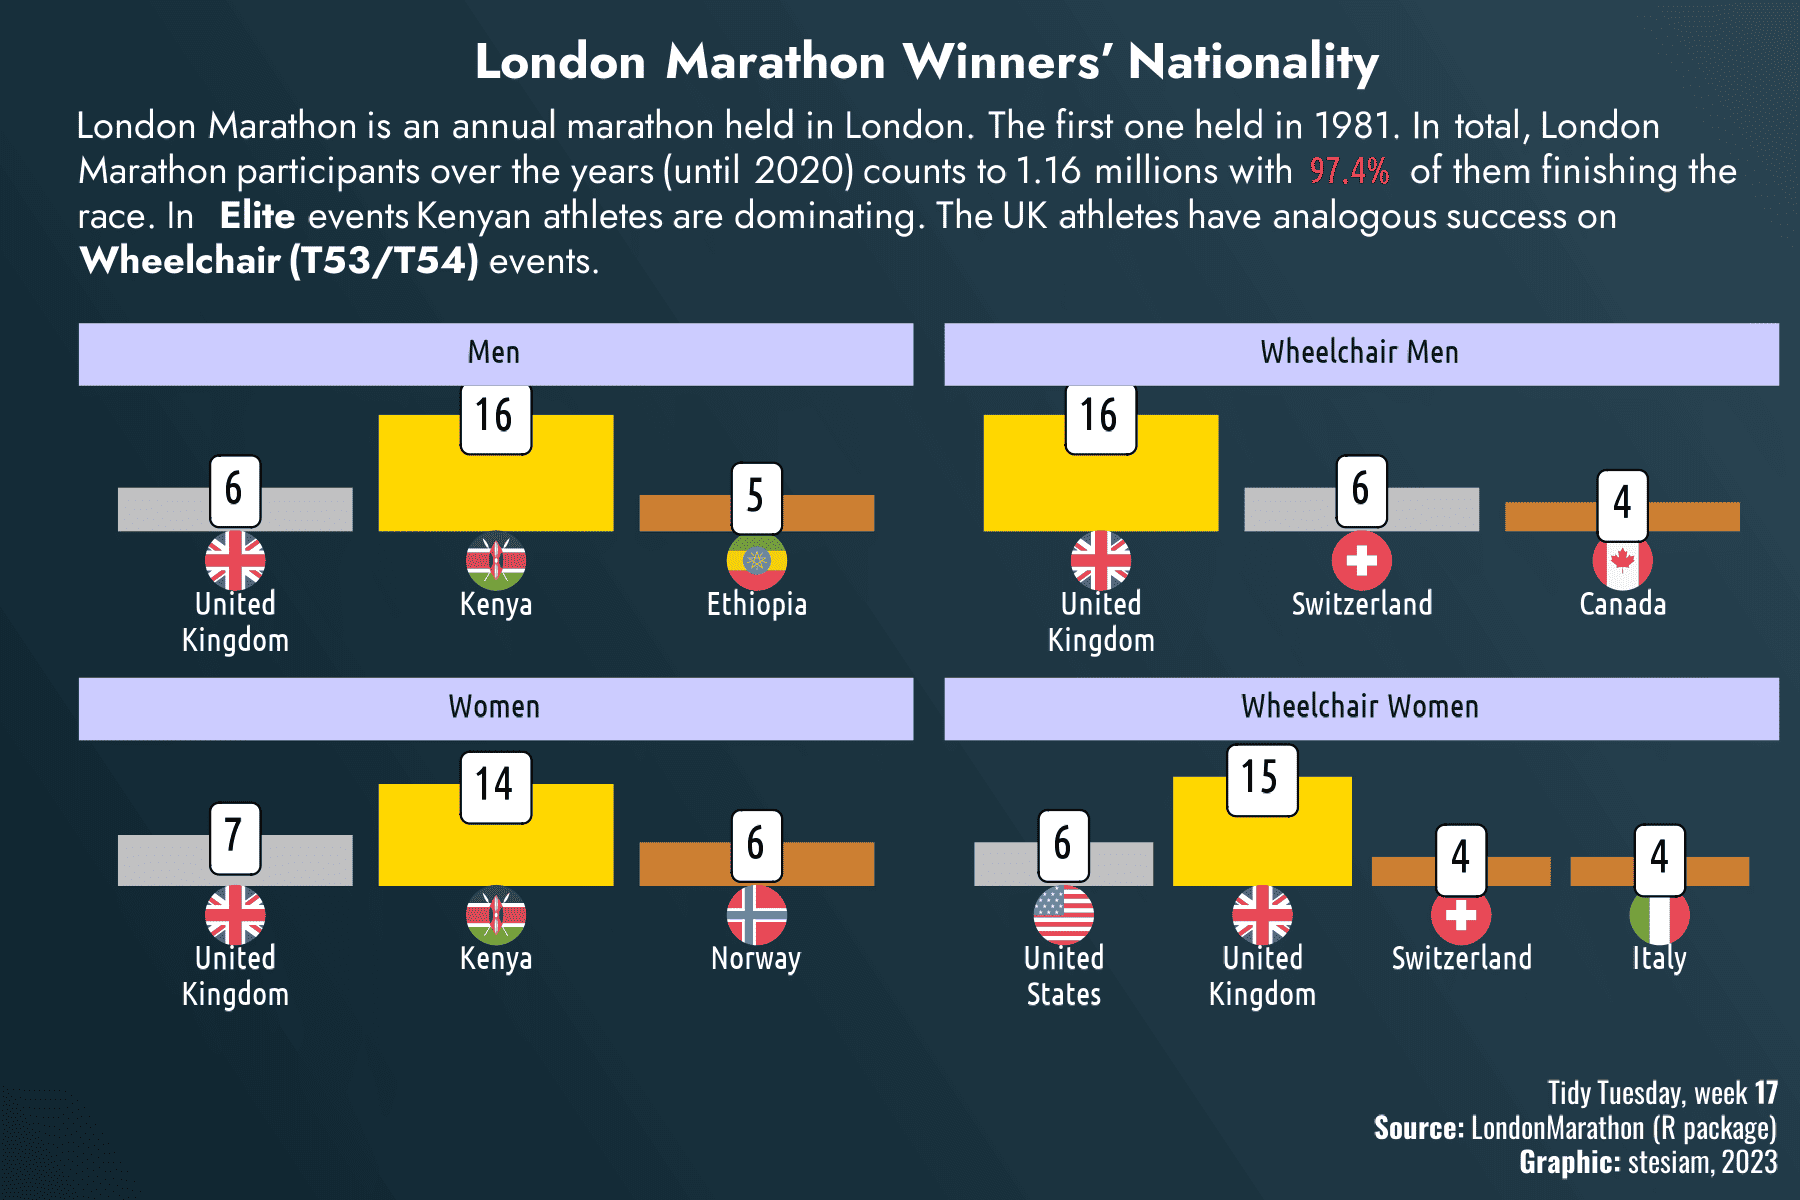
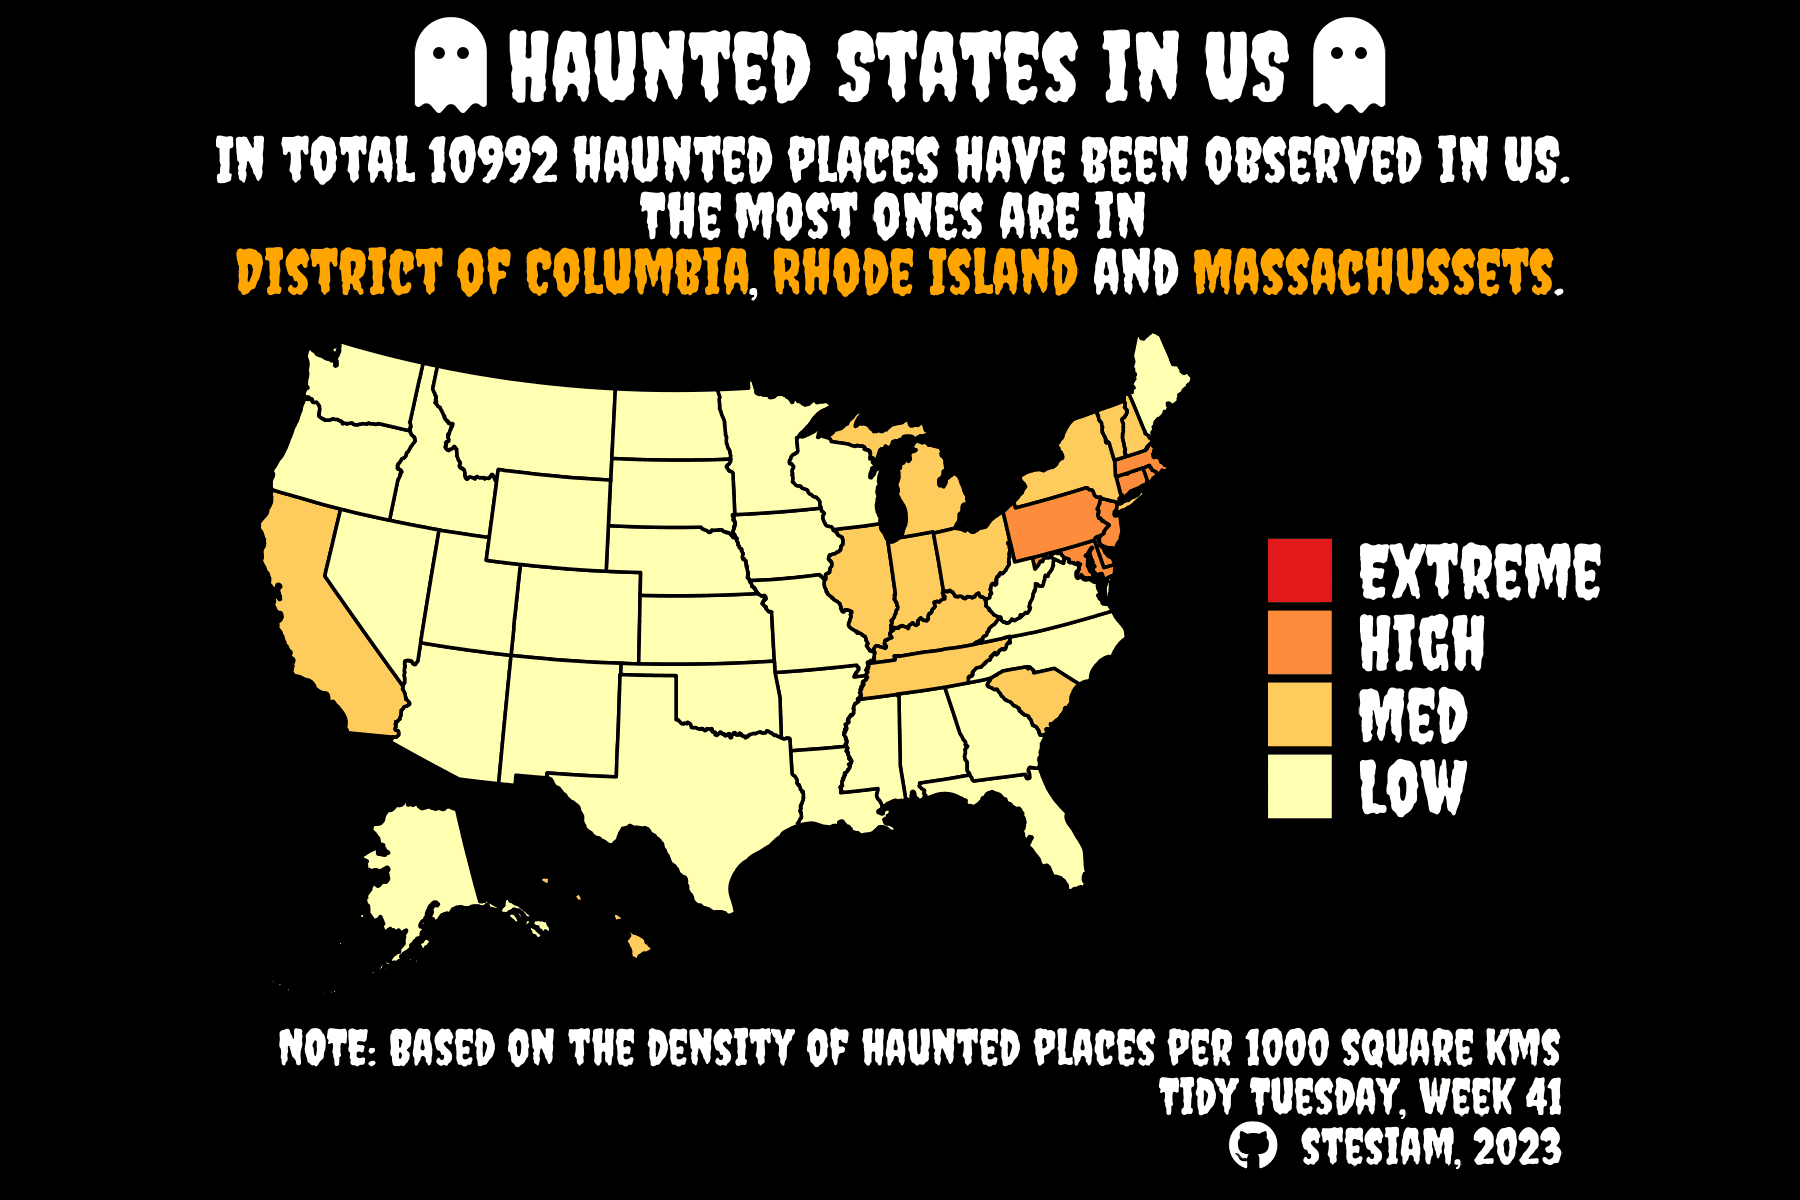
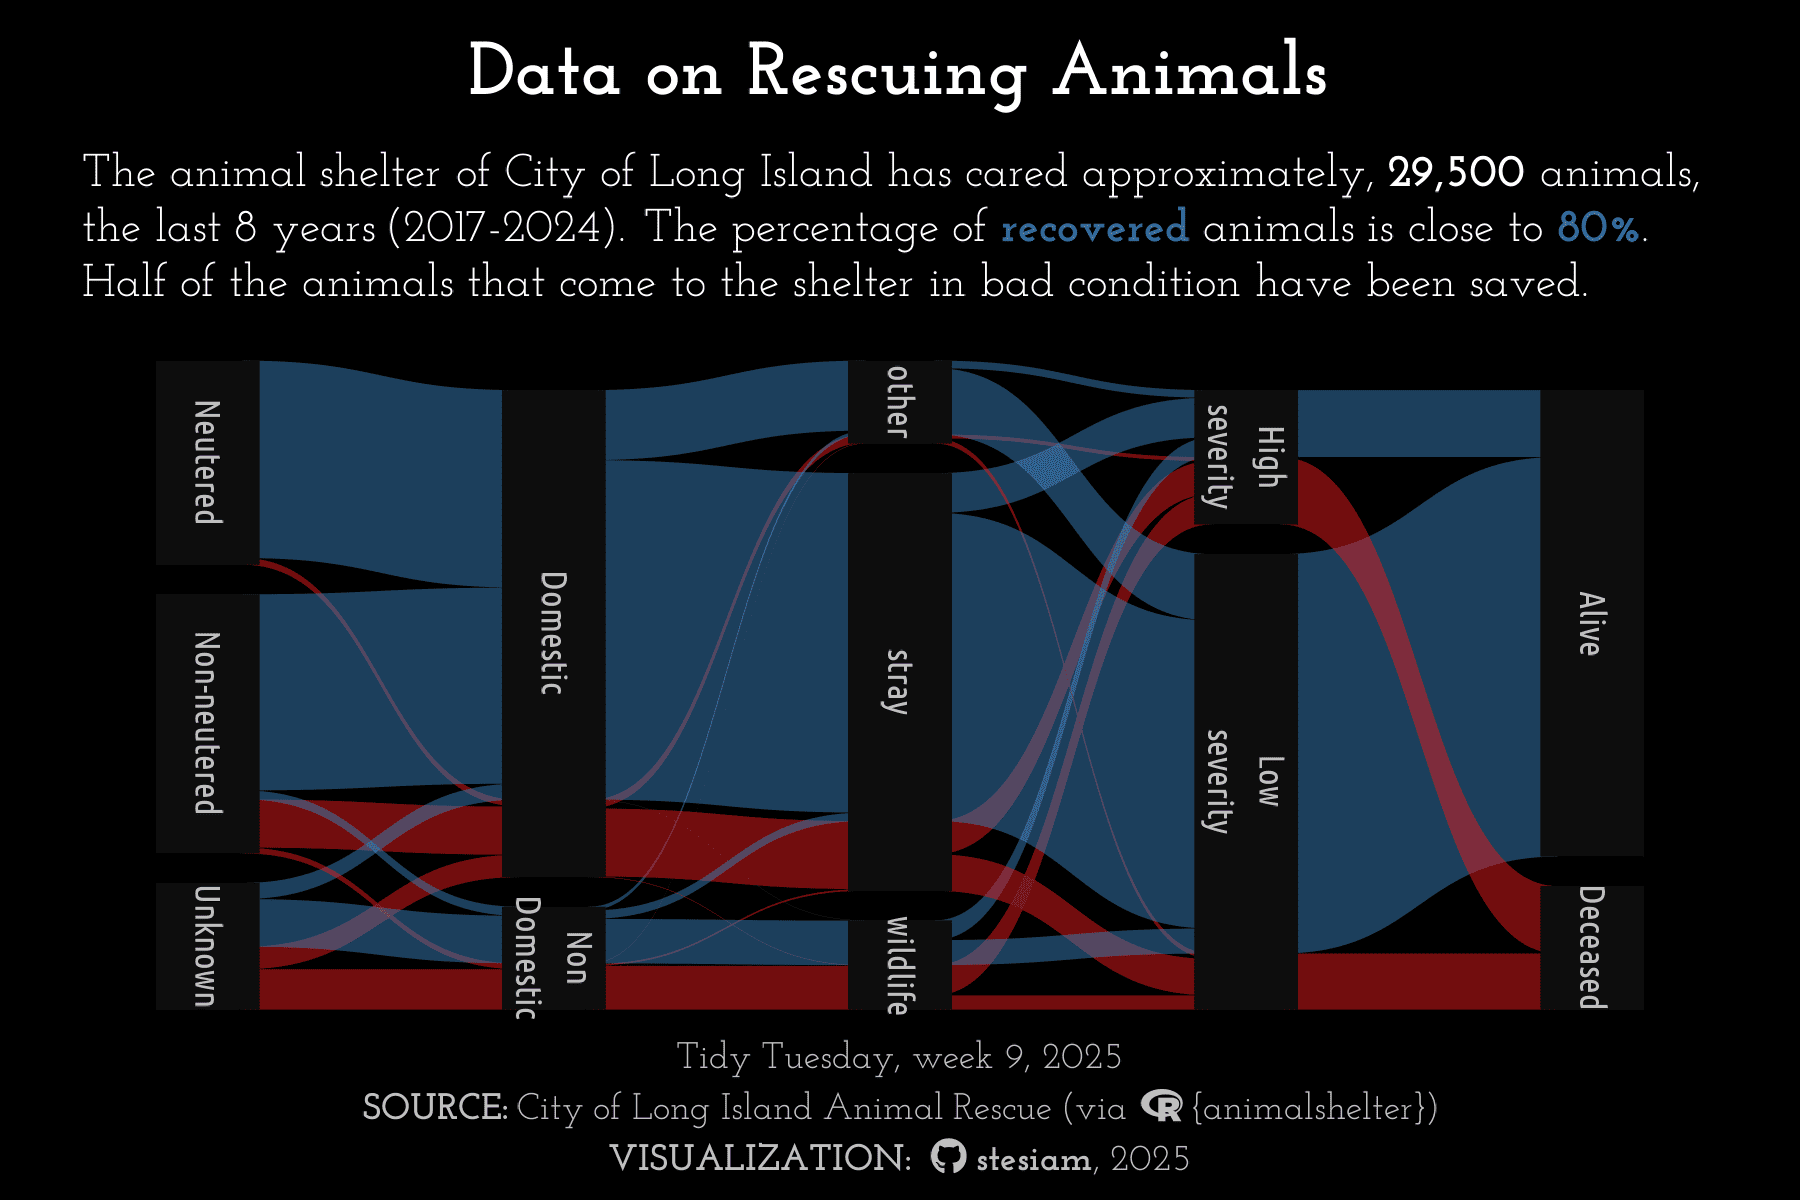
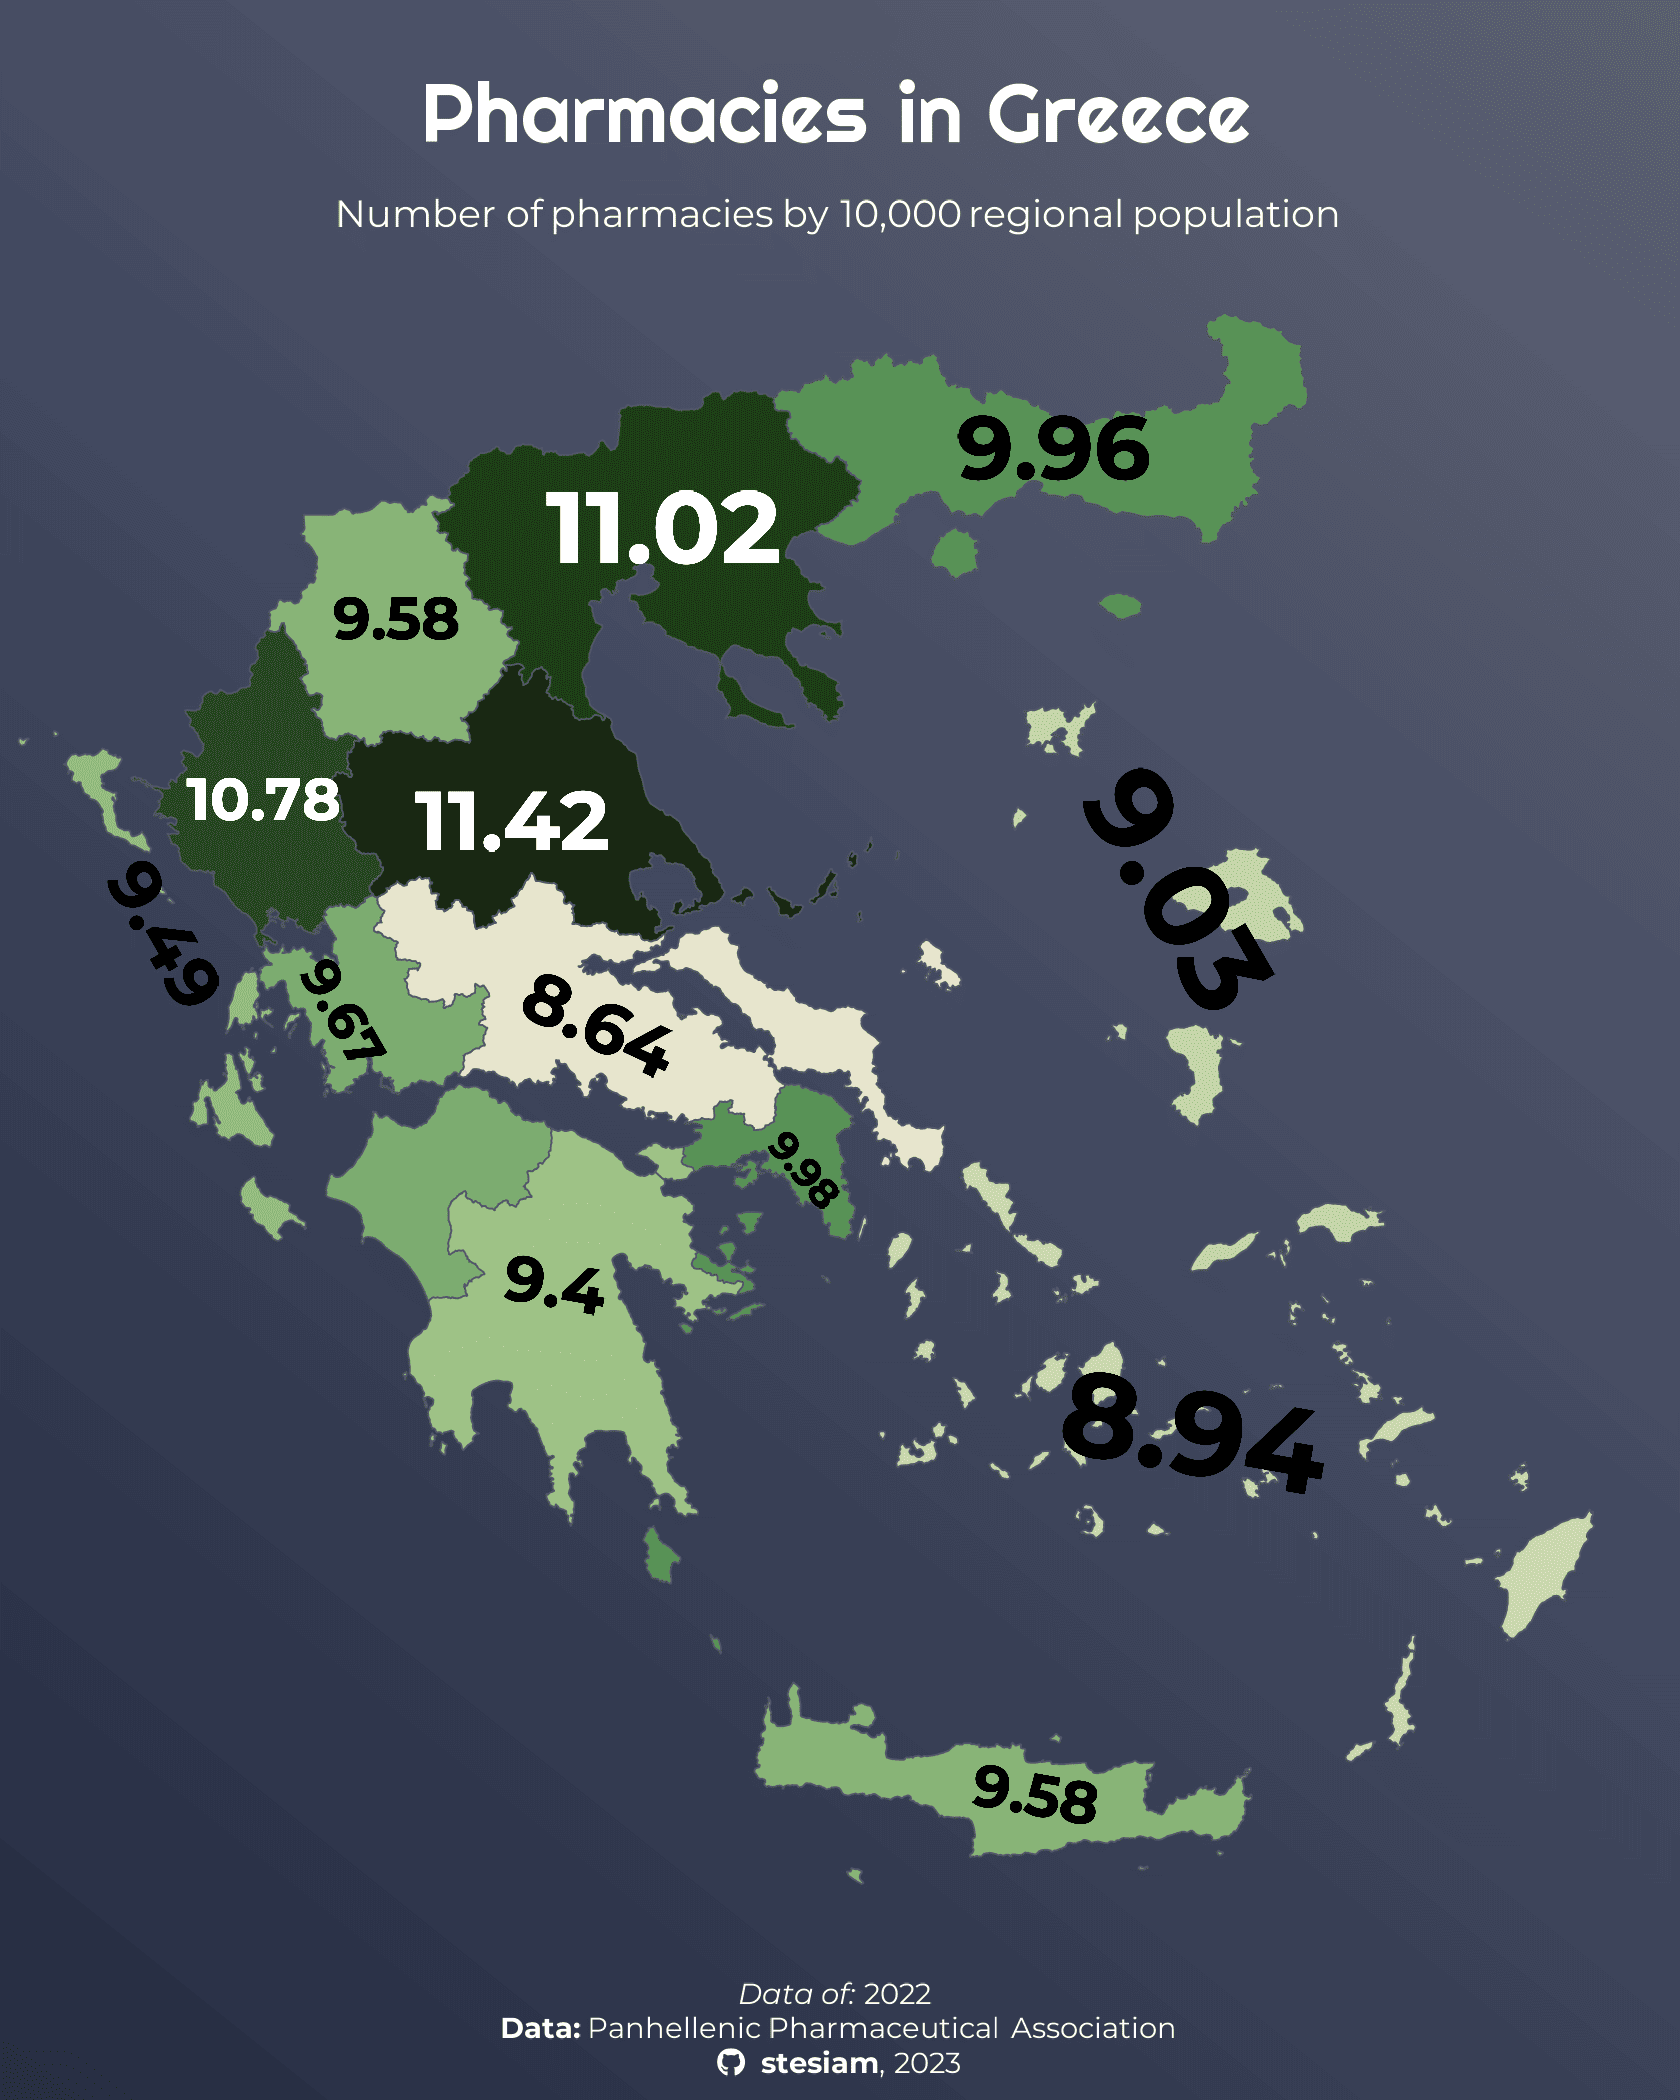
Αυτή είναι μία συλλογή διαδραστικών διαγραμμάτων. Η διάδραση στα δεδομένα μπορεί να αποτελέσει σημαντικό εργαλείο προκειμένου ο αναγνώστης να καταλάβει . Τέλος, ο κύριος λόγος που δημιούργησα αυτή την ενότητα είναι η ανάγκη για προσβάσιμο περιεχόμενο και να δοθεί μία εναλλακτική η οποία να είναι πιο προσβάσιμη από τα διαγράμματα που παρατίθενται παρακάτω. Τα διαγράμματα των υπολοίπων υποενοτήτων της σελίδας είναι στατικά με βασικά εναλλακτικά κείμενα. Προτείνεται σε άτομα που χρησιμοποιούν αναγνώστες οθόνης να δοκιμάσουν πρώτα το κουμπί εξερεύνησης που ακολουθεί για να έχουν μία καλύτερη εμπειρία χρήσης. Κάνω ότι καλύτερο μπορώ για να κάνω τη σελίδα μου πιο προσβάσιμη. Δέχομαι και διορθώσεις επισημάνσεις στο email μου αν προκύψει κάποιο πρόβλημα ή έχετε να μου προτείνετε κάποια αλλαγή ως προς τη βελτίωση της προσβασιμότητας της σελίδας μου.
30 Day Chart Challenge
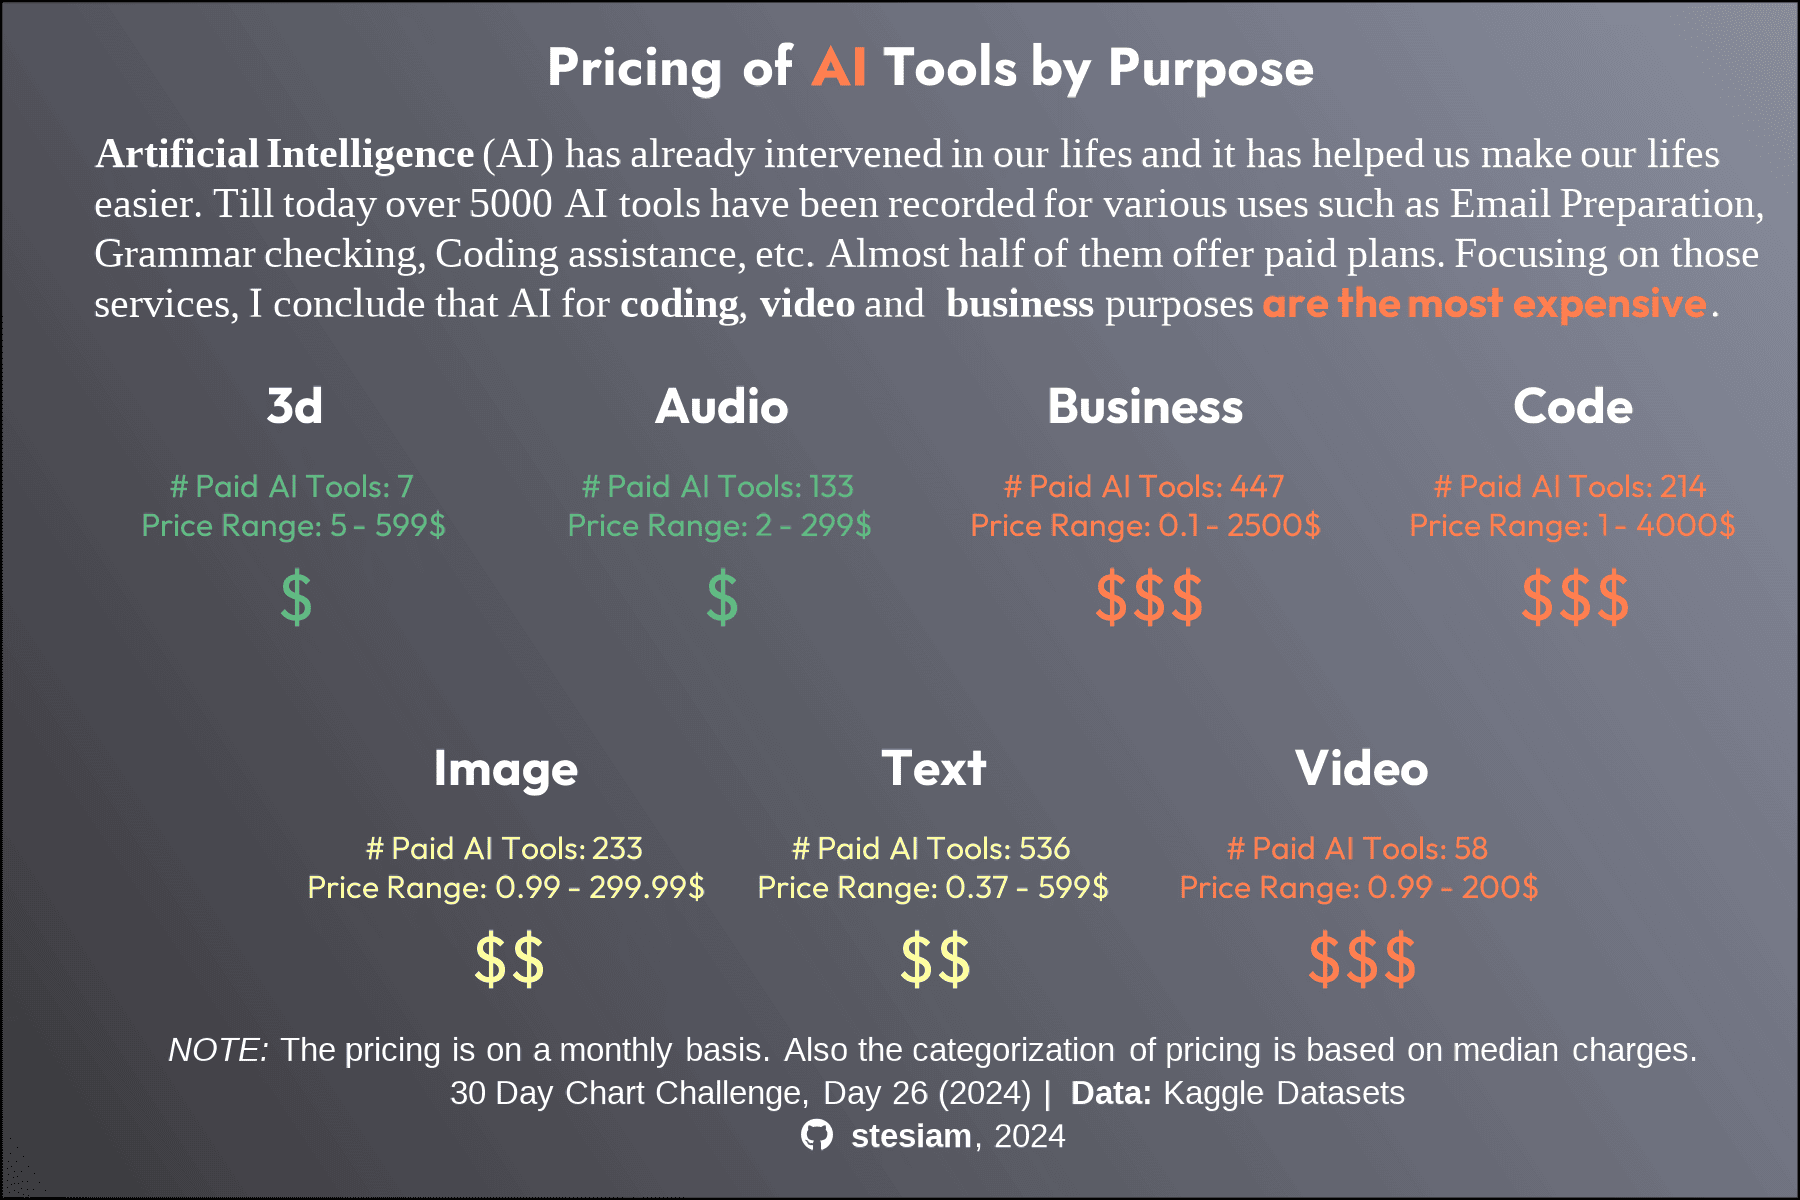
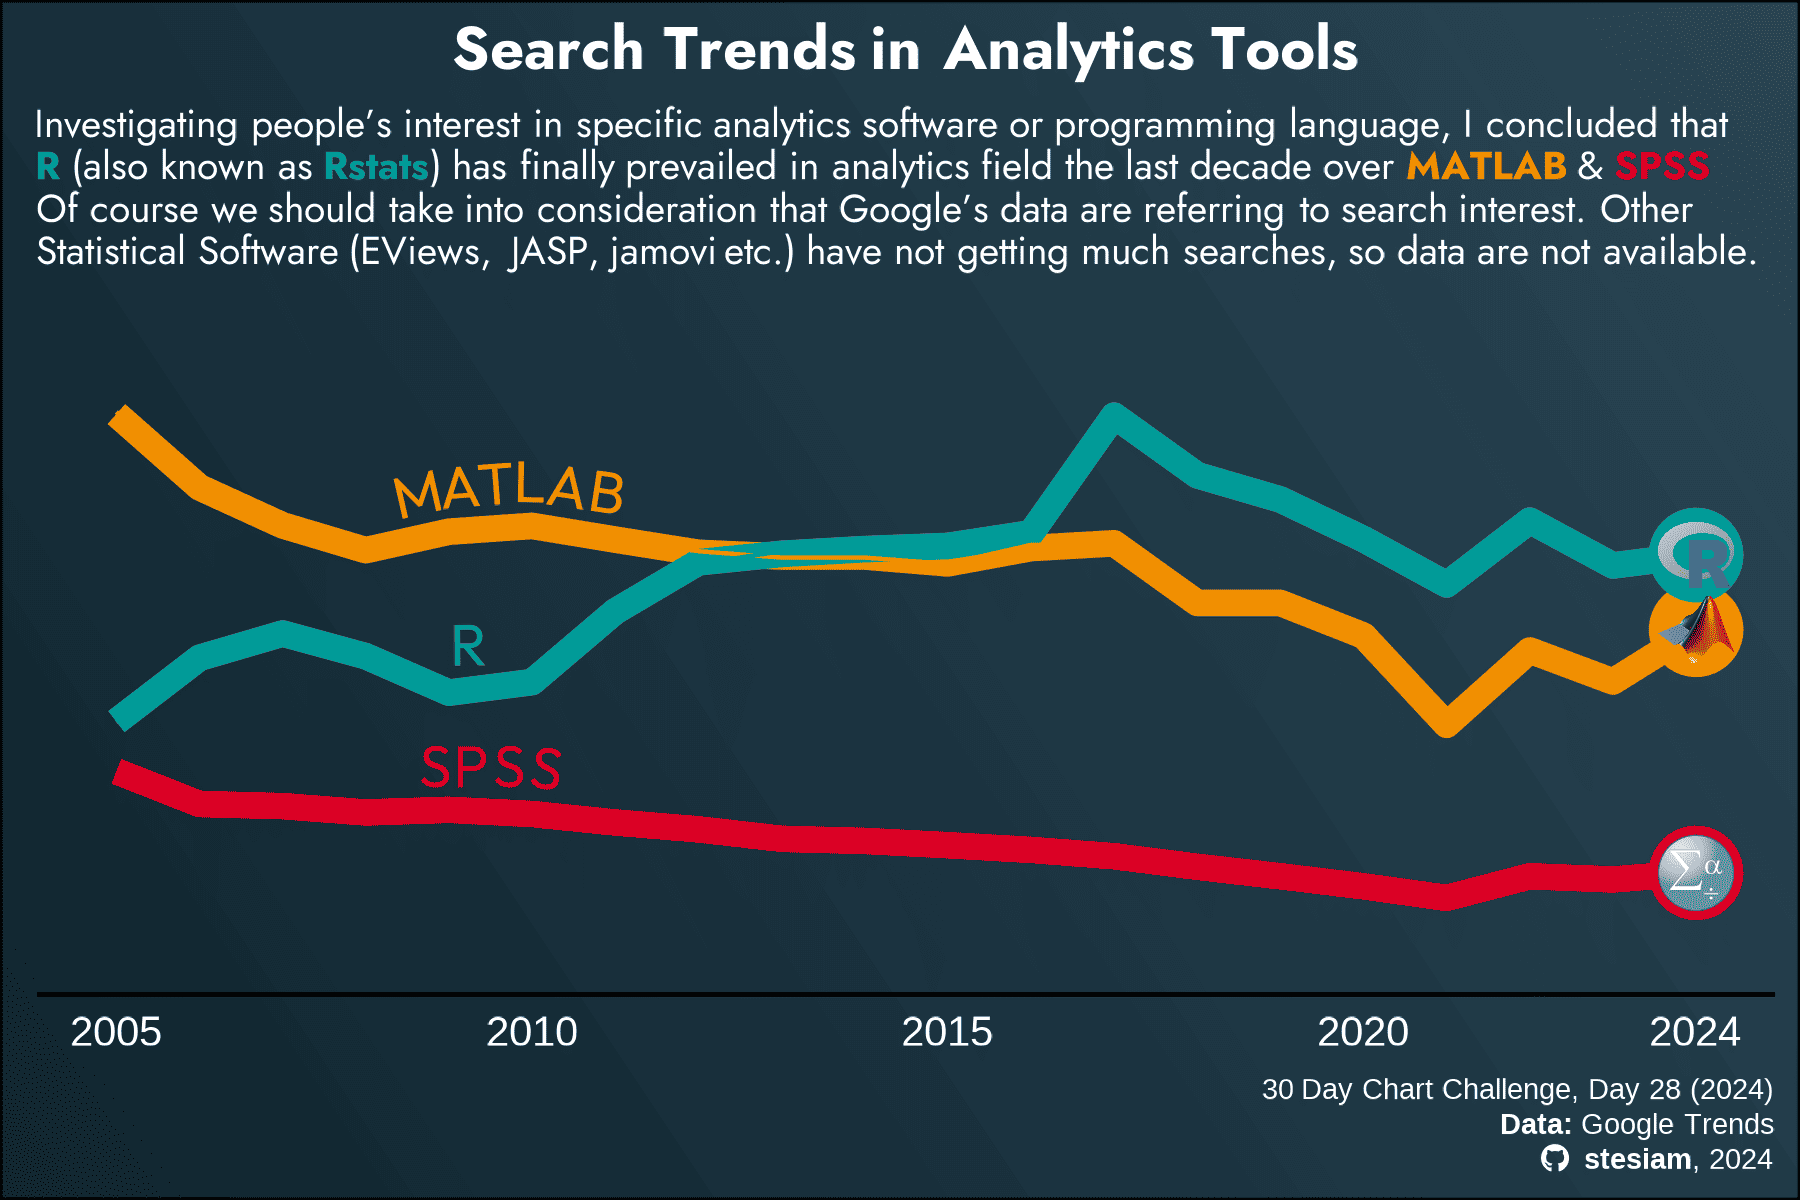
The 30 Day Chart Challenge is a global challenge held every April and invites data analysts and visualization enthusiasts to create a chart every day for 30 days. Each day has a different theme or chart type, encouraging creativity, data exploration and practicing analysis and design techniques.
Tidy Tuesday
30 Day Map Challenge
Inforgraphics
⛏️⛏️⛏️
