Charts

Data visualizations and interactive figures.

Interactive Charts

Charts built with D3.js and Highcharts. Hover for details, click the legend to toggle series.

D3.js 30 Day Chart Challenge · Day 1 · 2024

Supermarket Sales

Market share analysis of the largest supermarket chains in Greece for 2022. Sklavenitis dominates with a 36.1% share and €5.35B in revenue.

Source: ΙΕΛΚΑ - Greek Supermarket Panorama

Highcharts ΕΛΣΤΑΤ · 2021

Population Pyramid of Greece

Population distribution by age and sex from the 2021 Census. The aging population is evident, with the largest cohort in the 40–44 age group.

Source: ELSTAT - Population Census 2021

Highcharts ΑΔΜΗΕ · 2019–2023

Electricity Generation by Source

Evolution of electricity generation in Greece by energy source (TWh), 2019–2023. The rapid rise of renewables and steady phaseout of lignite are clearly visible.

Source: IPTO (ΑΔΜΗΕ) - Annual System Report

Highcharts ΕΛΣΤΑΤ · 1990–2020

Registered Vehicles by Category in Greece

Evolution of registered vehicles in Greece by category, 1990–2020. Motorcycles saw a remarkable +538% increase while buses remained nearly flat.

Source: ELSTAT - Registered Vehicles Registry

Highcharts Google Trends · 2005–2024

Statistical Software Popularity

Monthly Google Trends index (0–100) for MATLAB, R, and SPSS, 2005–2024. R overtook MATLAB around 2013 and has remained dominant since.

Source: Google Trends

Highcharts ΕΛΣΤΑΤ · 2022

Greek Trade Flows - Imports & Exports

Greece's imports (left) and exports (right) by region (2022). Imports of €88.5bn far exceed exports of €54.5bn. The Trade Deficit node absorbs the €34bn gap.

Source: ELSTAT - External Trade Statistics (2022)

Static Charts

Charts built with R and ggplot2. Includes entries from visualization challenges (30 Day Chart Challenge, TidyTuesday, 30 Day Map Challenge) as well as standalone analyses on Greece and the EU. Click any chart to zoom in.
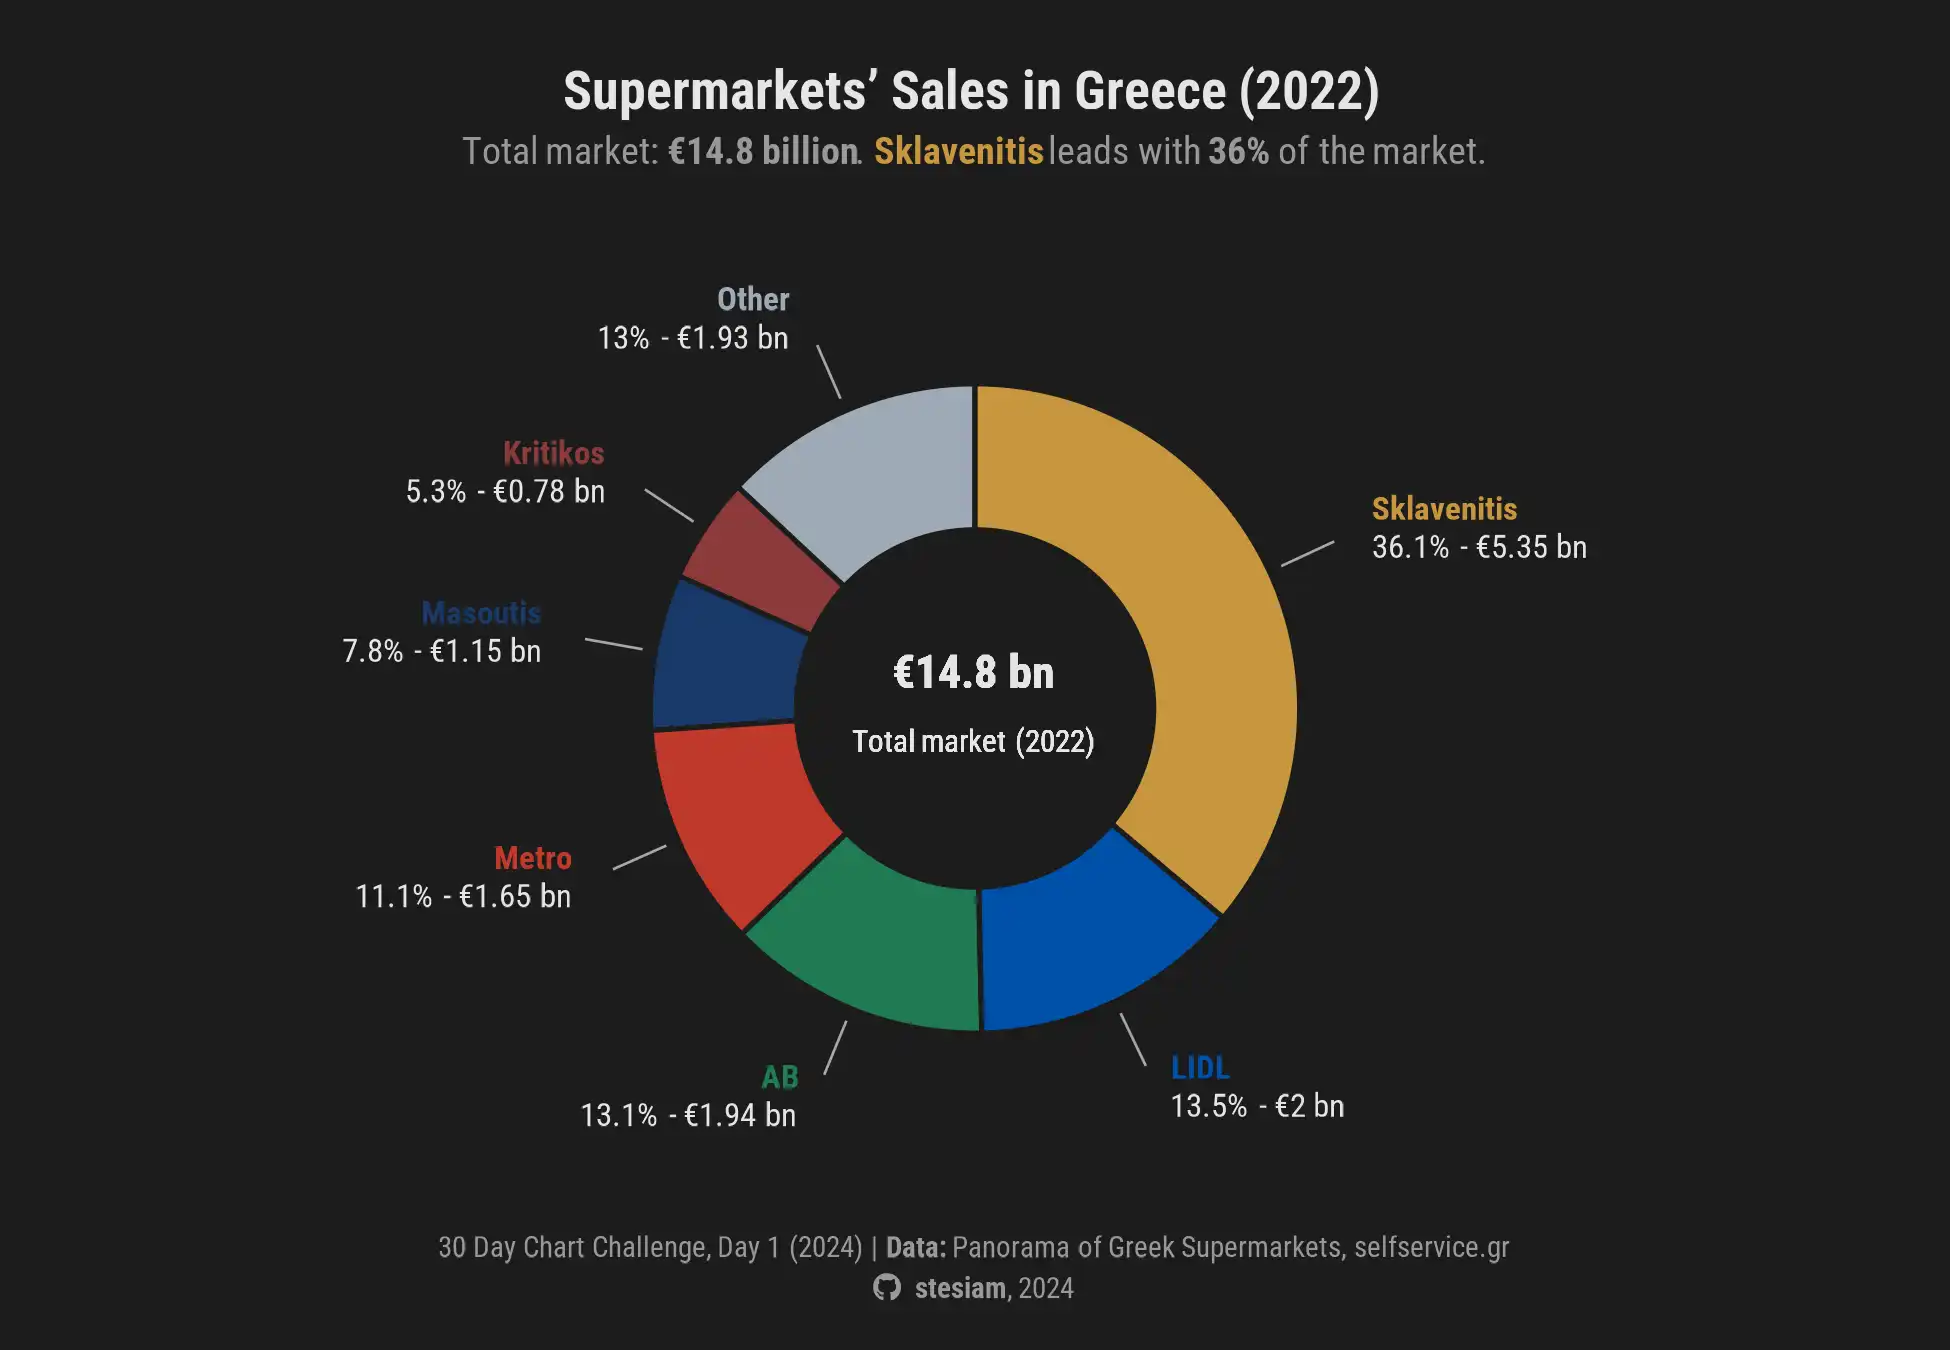
Donut chart of Greek supermarket revenue in 2022, €14.8bn in total. Sklavenitis leads with 36.1%, followed by LIDL 13.5%, AB 13.1%, Metro 11.1%, Masoutis 7.8% and Kritikos 5.3%.
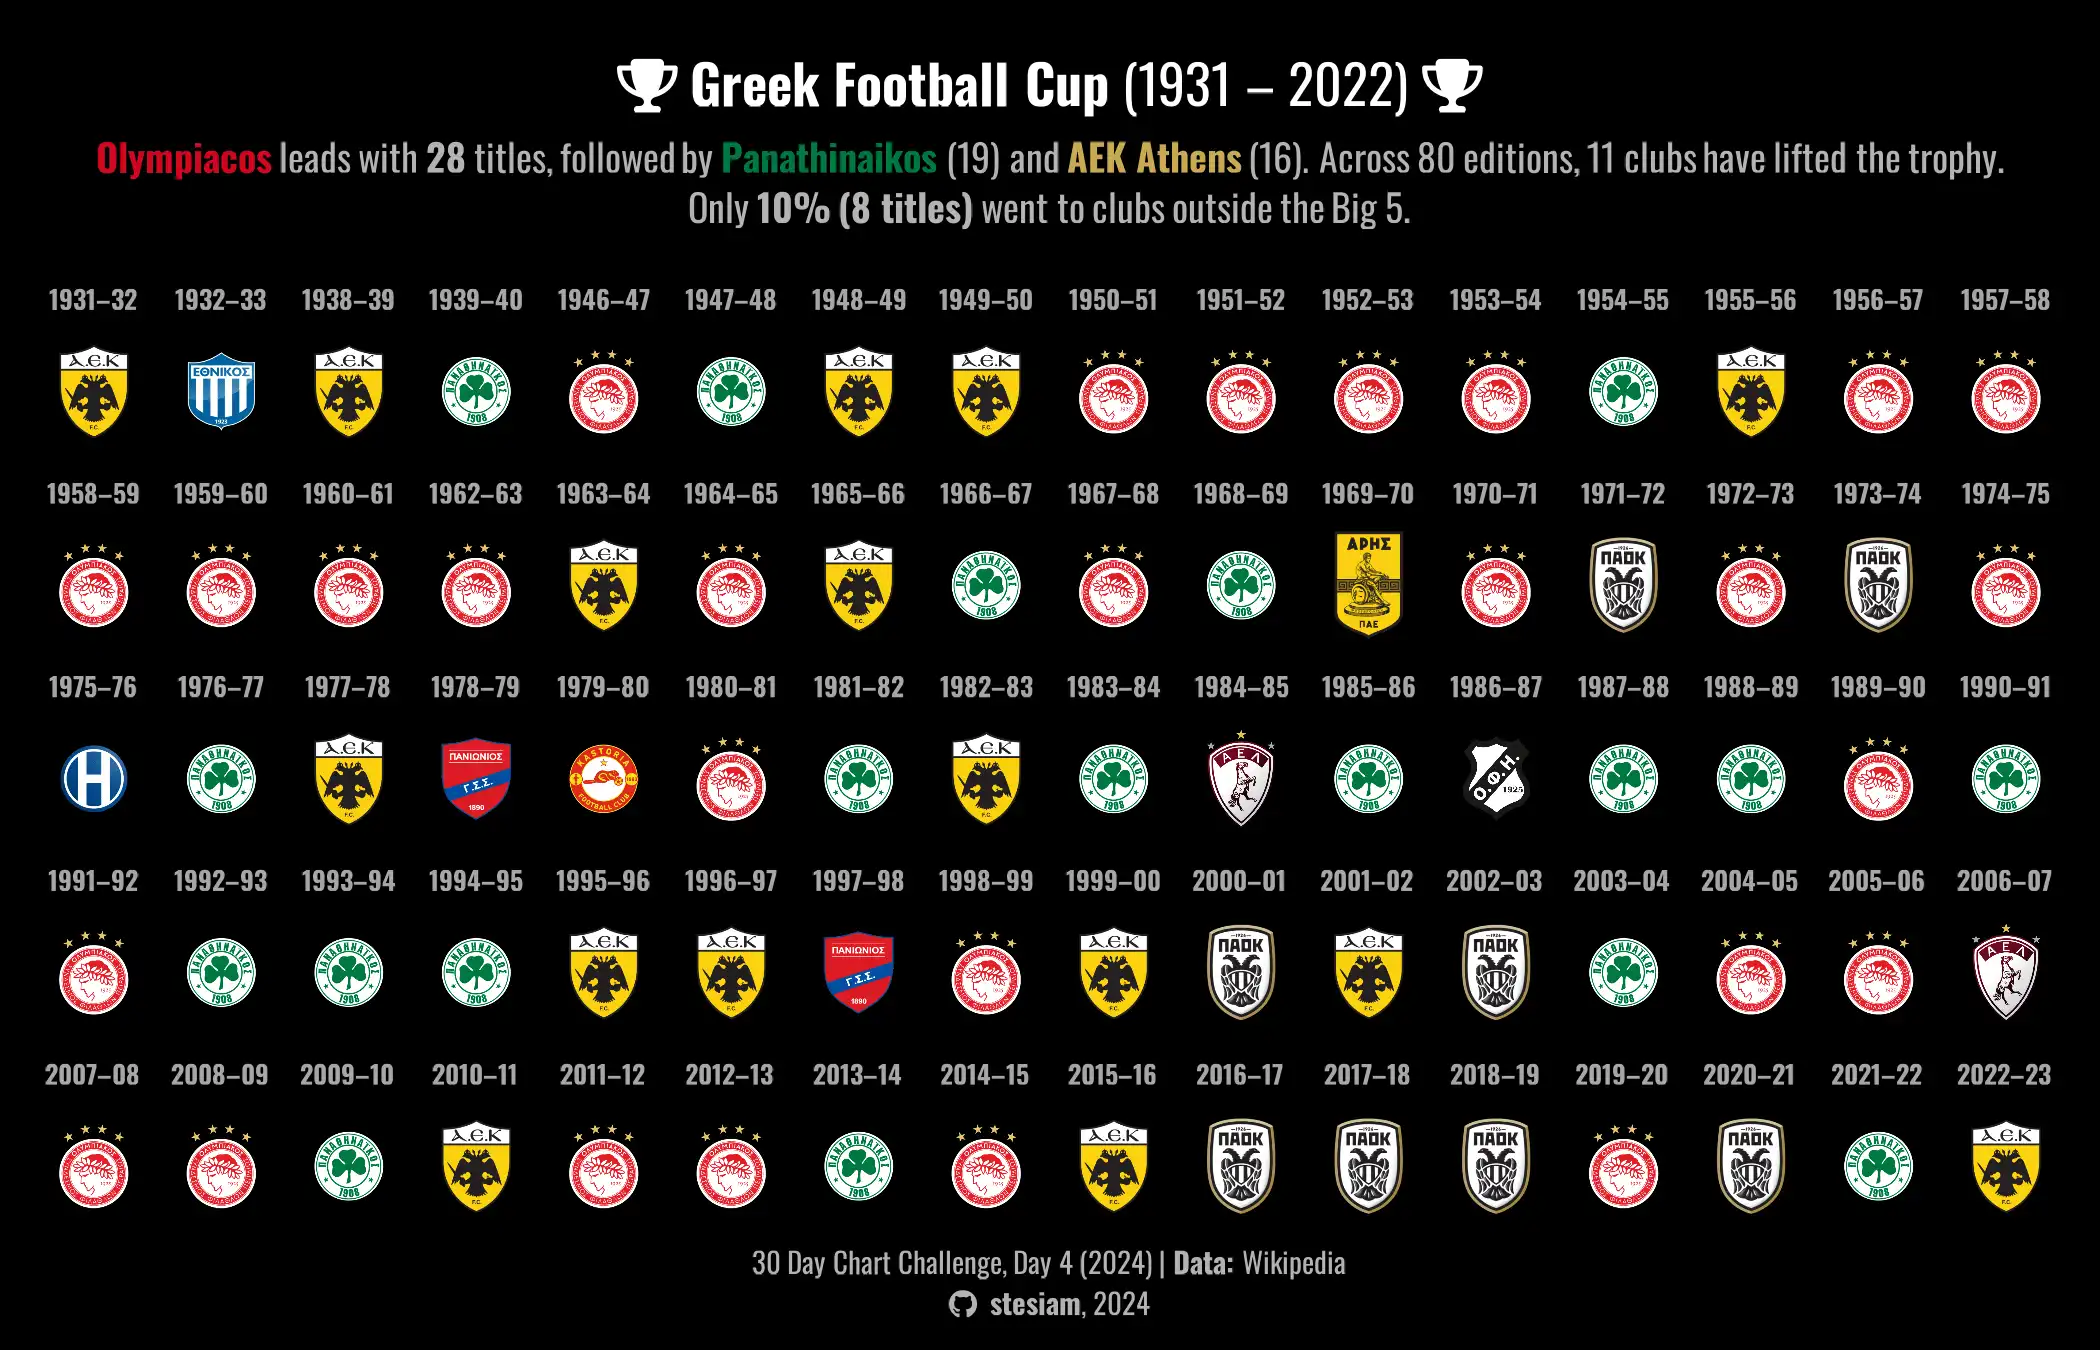
Greek Cup winners from 1931 to 2022, shown with each season's winning club crest. Olympiacos lead with 28 cups, followed by Panathinaikos with 19 and AEK with 16.
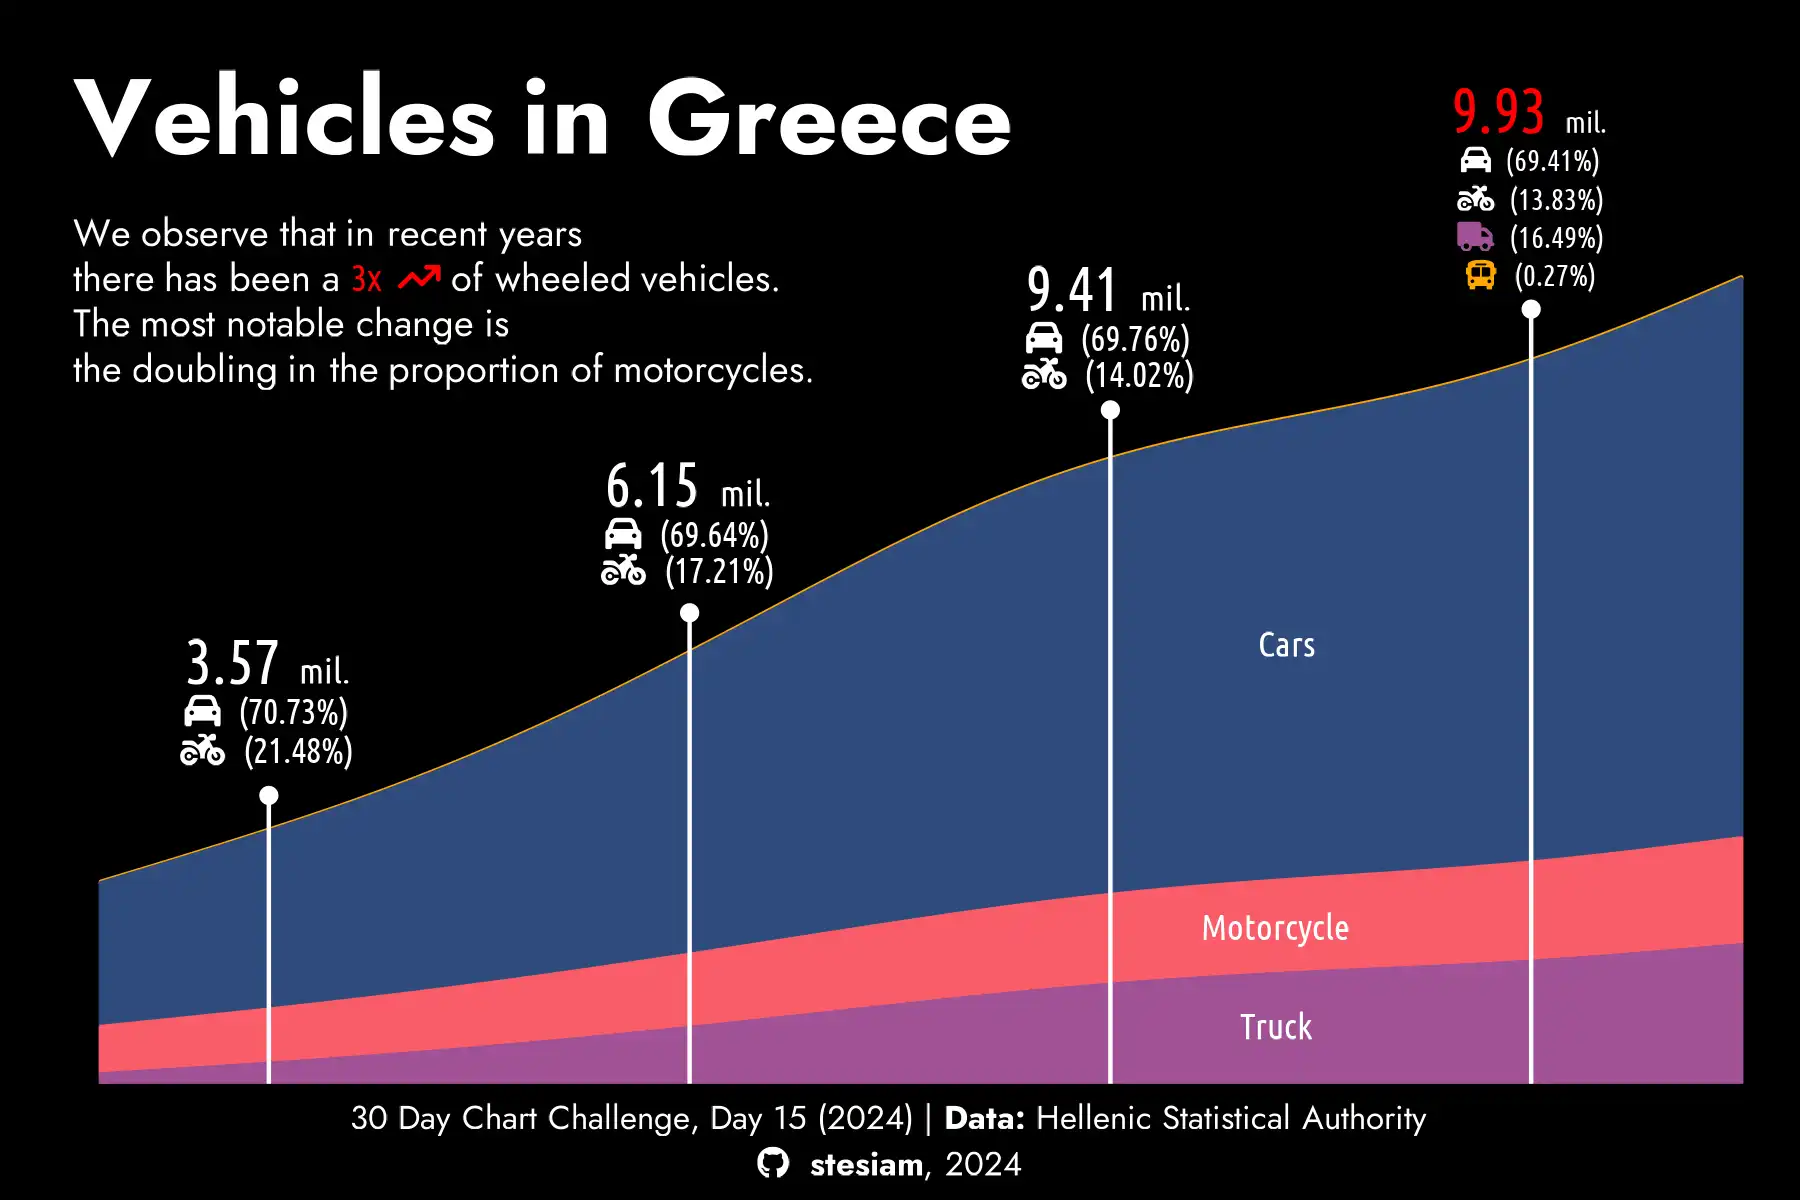
Area chart of vehicles in Greece from 1990 to 2020. The total almost tripled, from 3.57 to 9.93 million. Cars stay around 70%, while the share of motorcycles doubled.
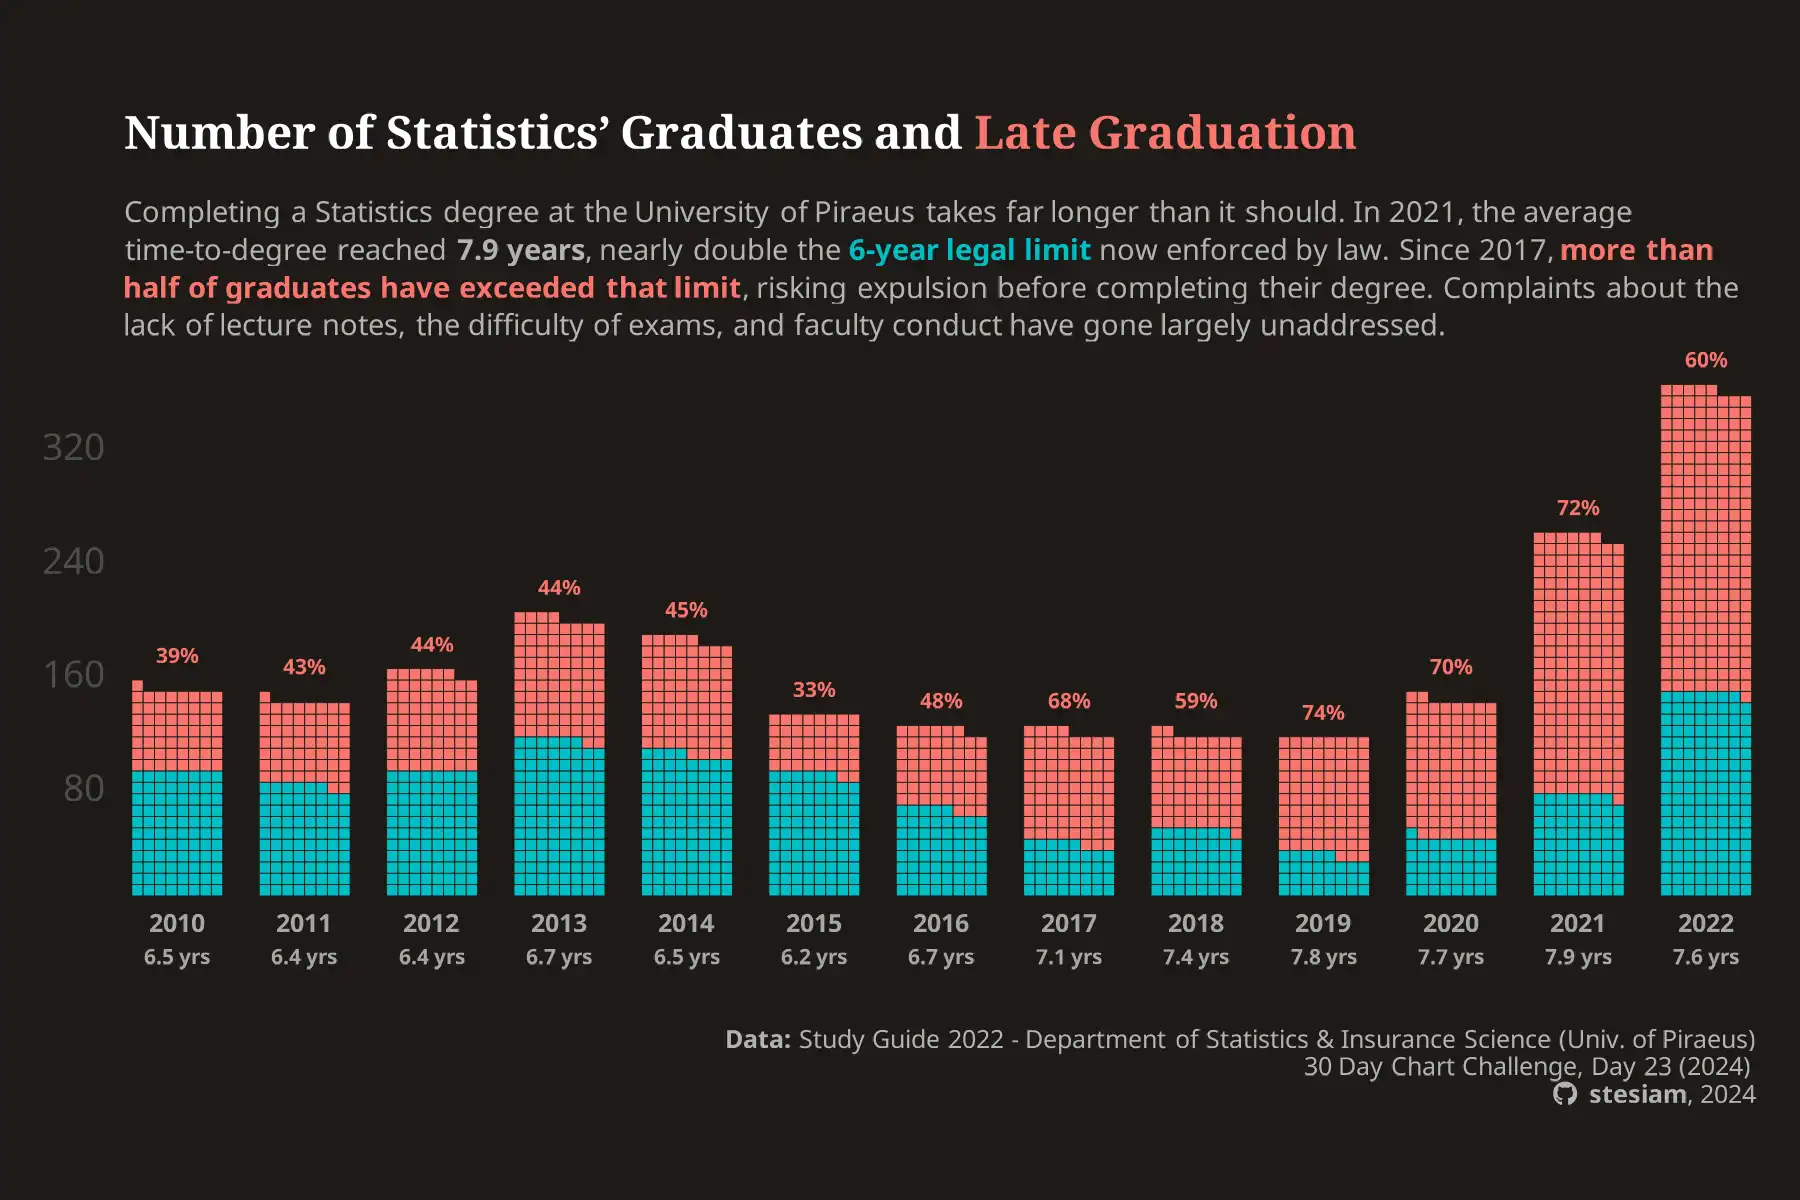
Bar chart of graduates of the Statistics department at the University of Piraeus from 2010 to 2022. Average time to degree rose from 6.5 to almost 8 years, and since 2017 more than half graduate after the 6-year limit.
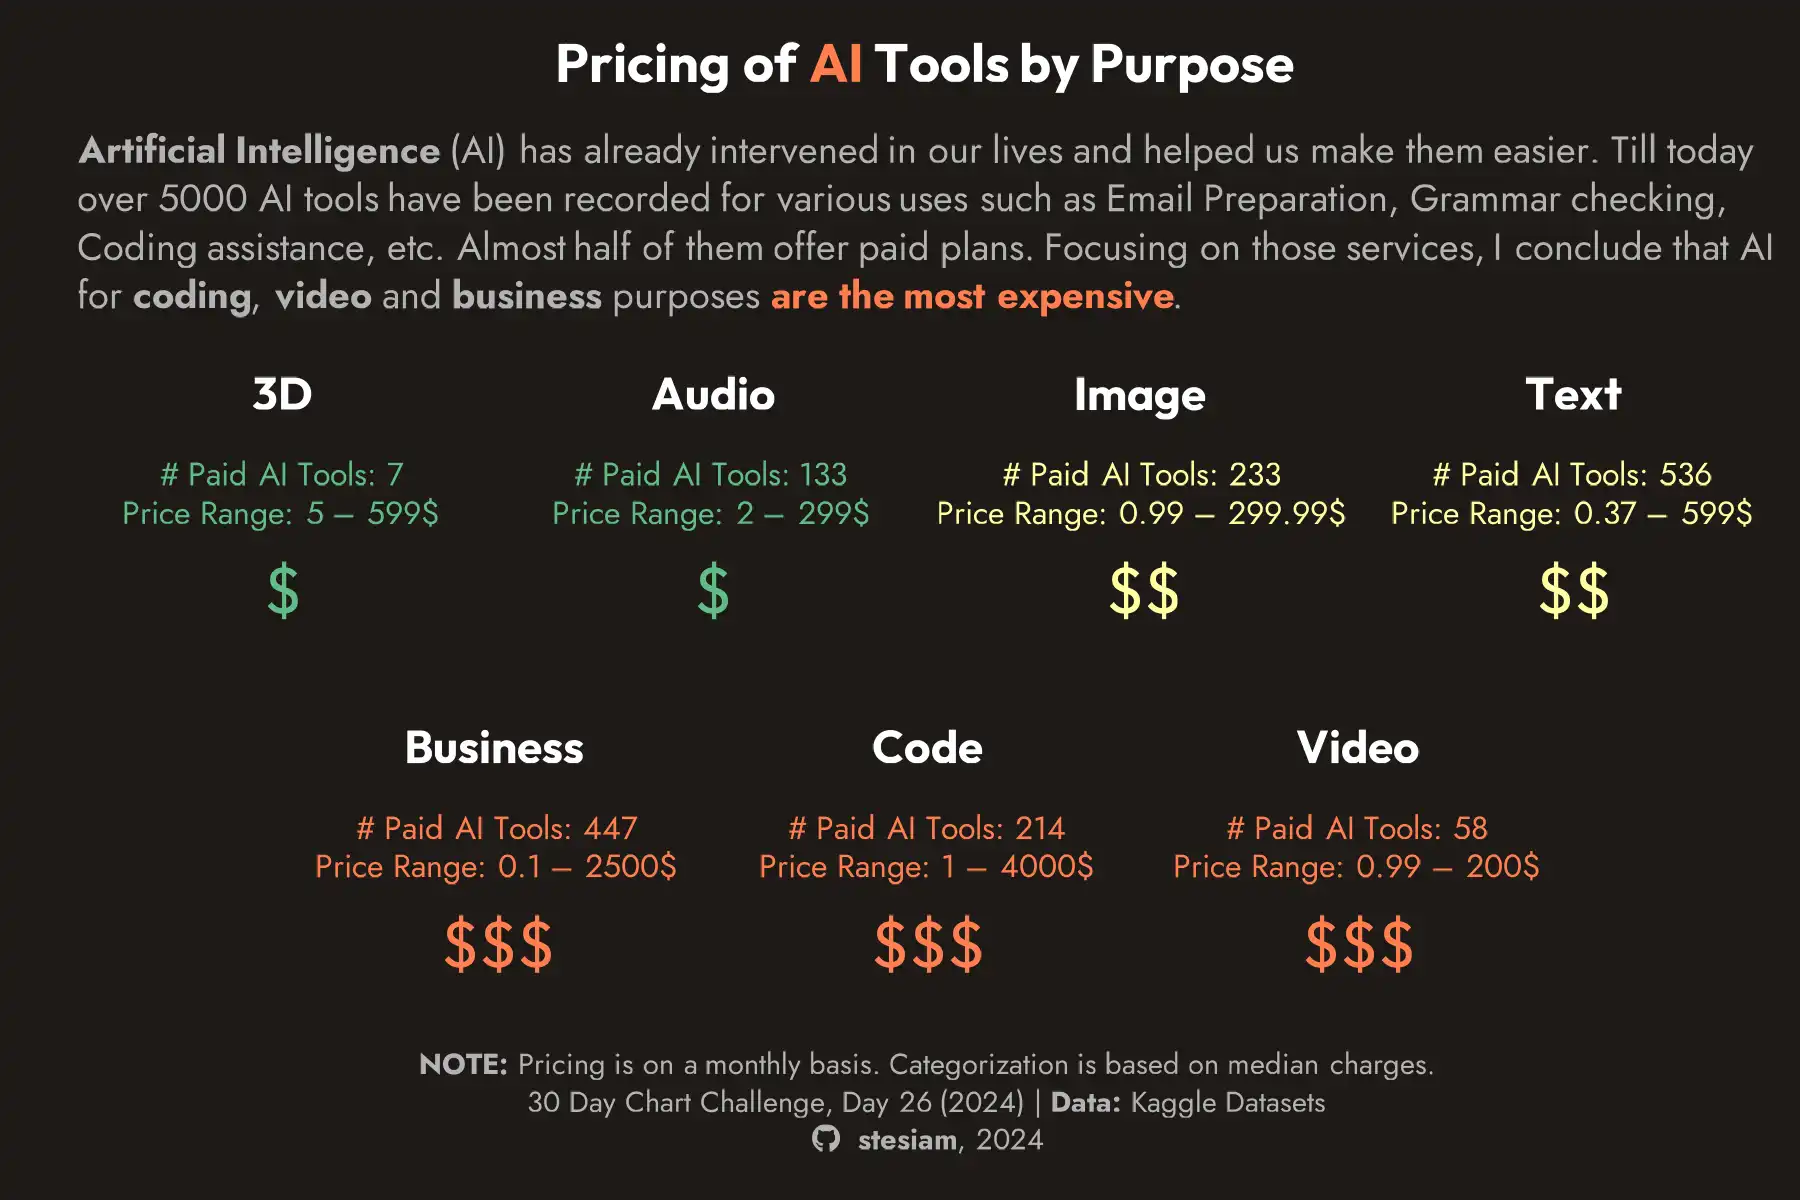
AI tools by area of use, with their count and monthly price range. The most expensive are business (up to $2,500), programming (up to $4,000) and video tools. The cheapest are 3D and audio.
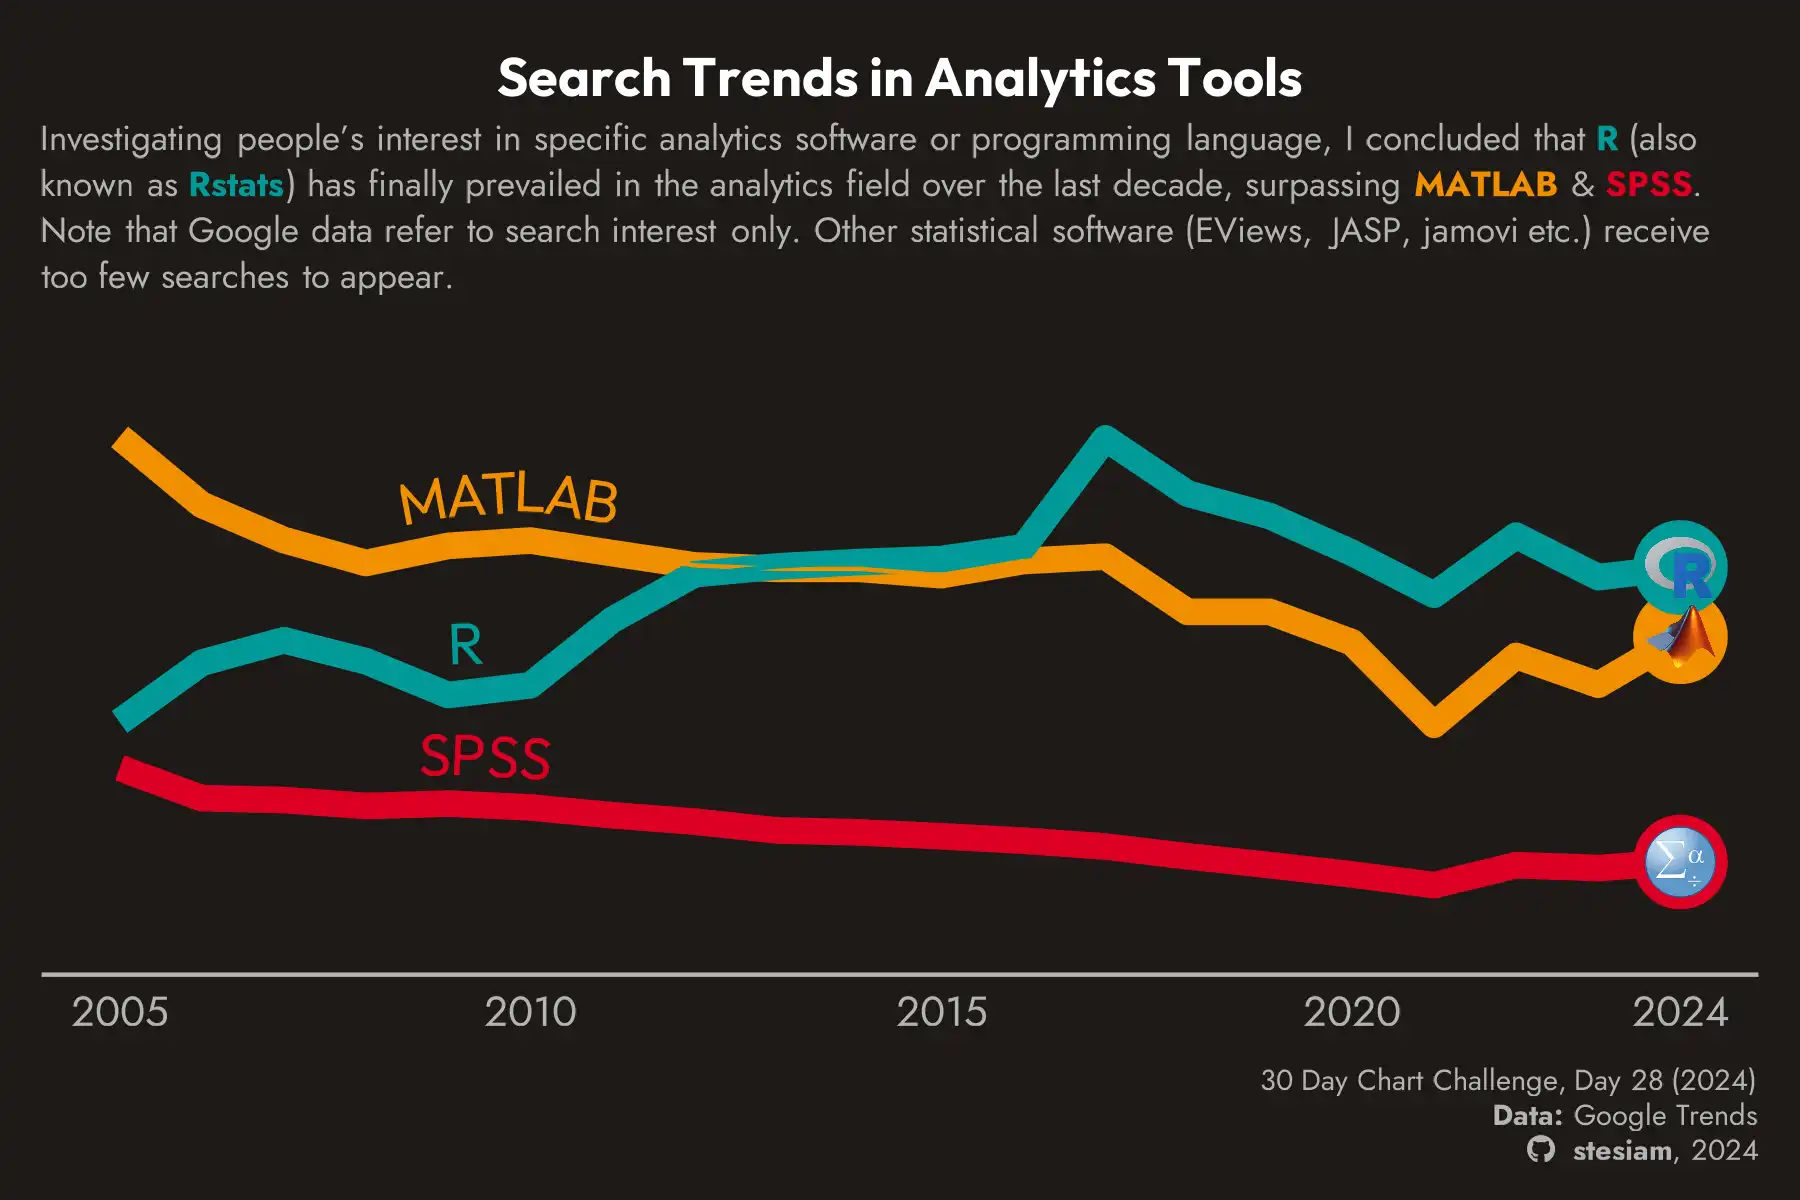
Line chart of Google search interest in R, MATLAB and SPSS from 2005 to 2024. R overtook MATLAB around 2013 and has led since, while SPSS stays last with a downward trend.
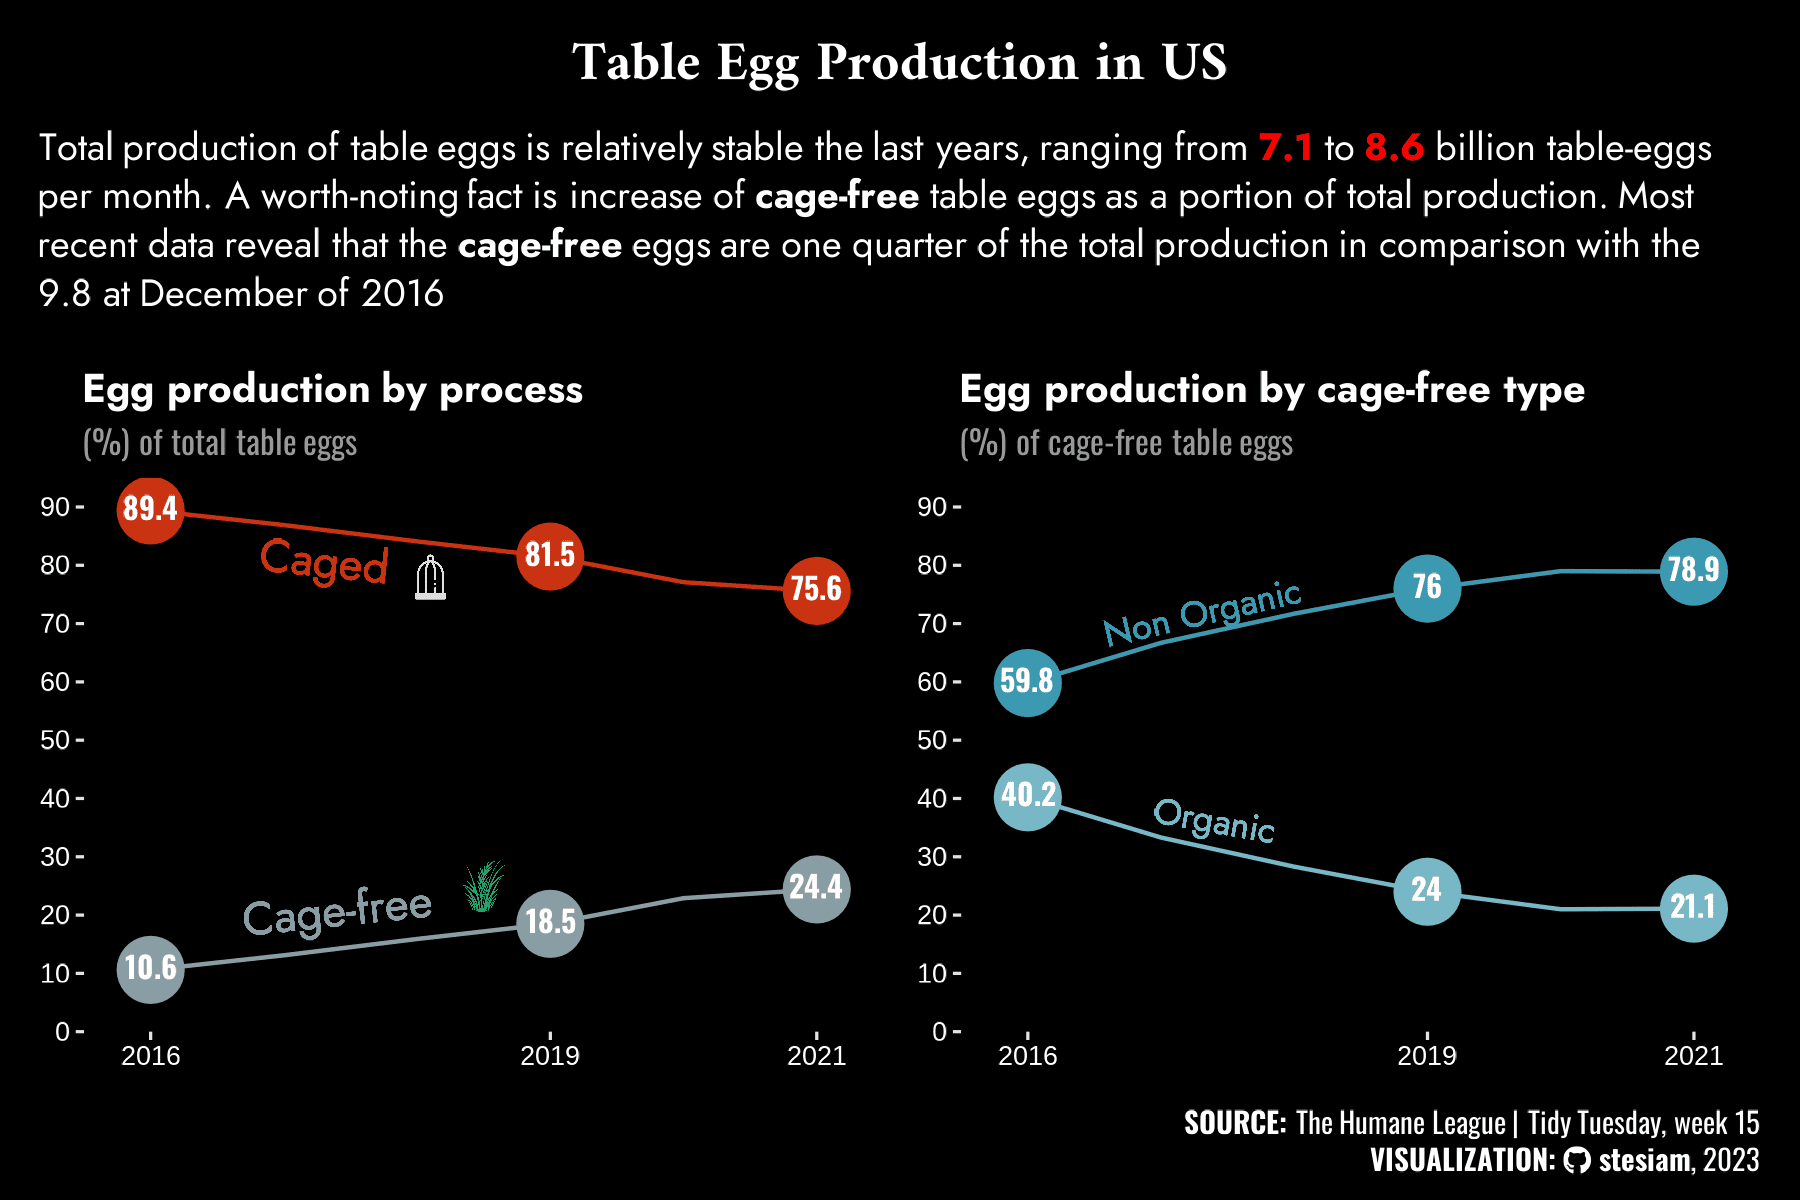
US table egg production from 2016 to 2021. Cage-free eggs rose from 10.6% to 24.4% of production, while caged eggs fell from 89.4% to 75.6%.
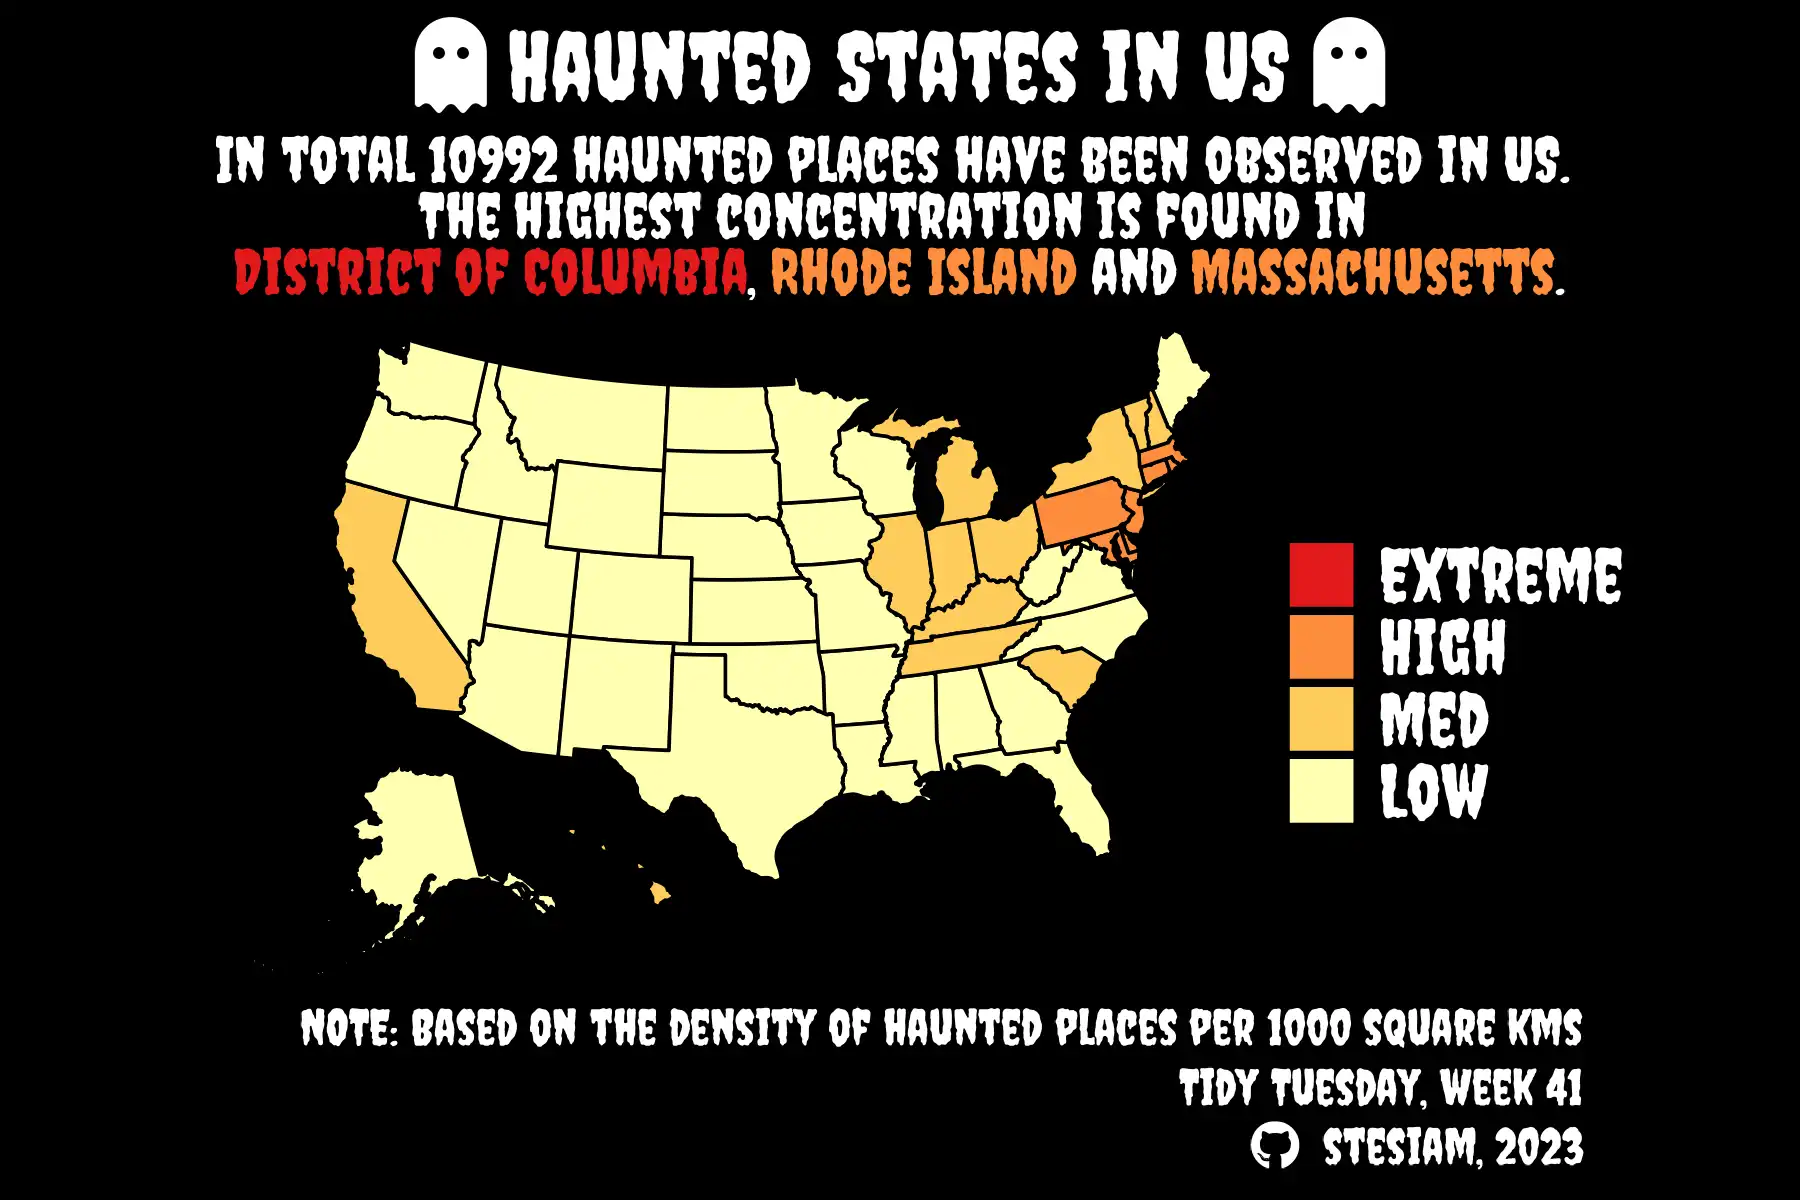
Map of the US showing the density of haunted places by state, 10,992 in total. The highest concentrations are in Washington DC, Rhode Island and Massachusetts.
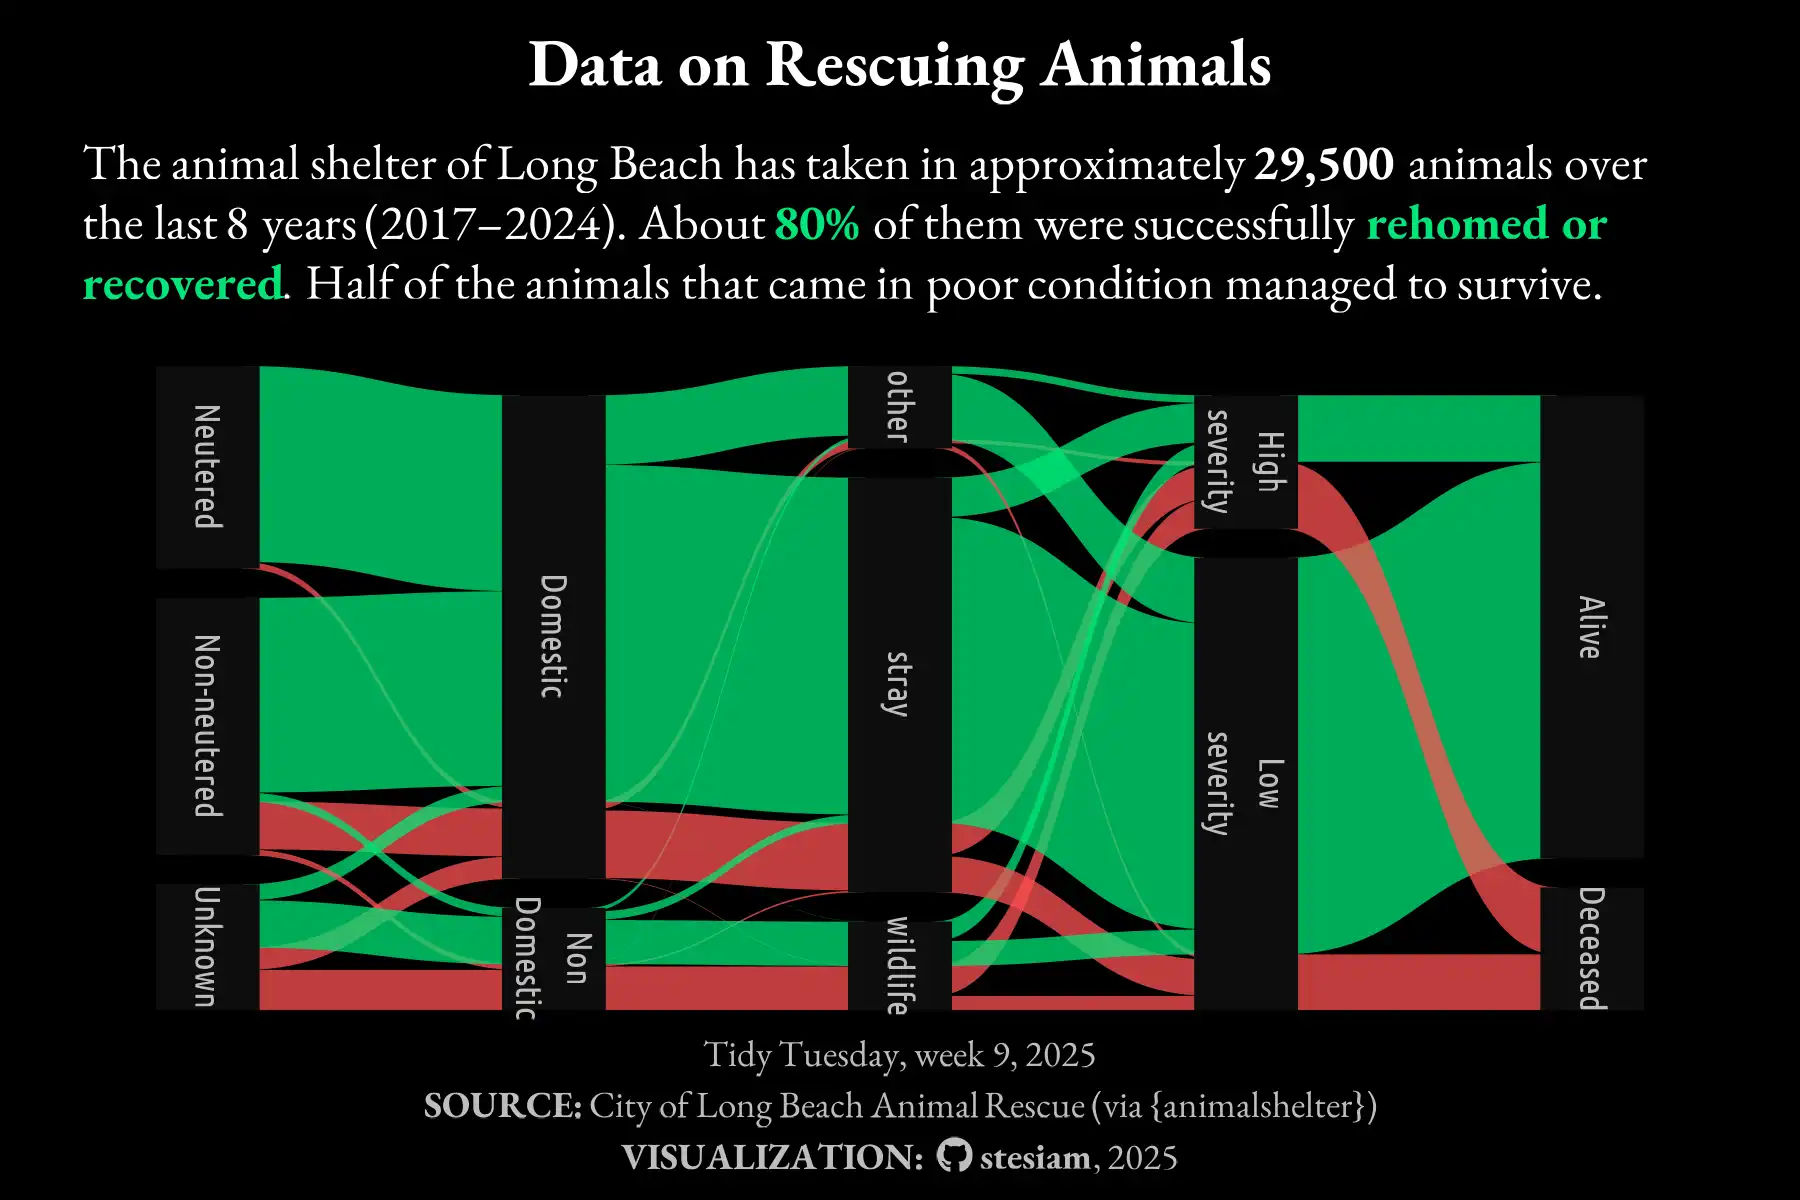
Flow diagram of the more than 29,500 animals at the Long Beach shelter from 2017 to 2024, from intake condition to outcome. About 80% recovered, and half of those that arrived in poor condition survived.
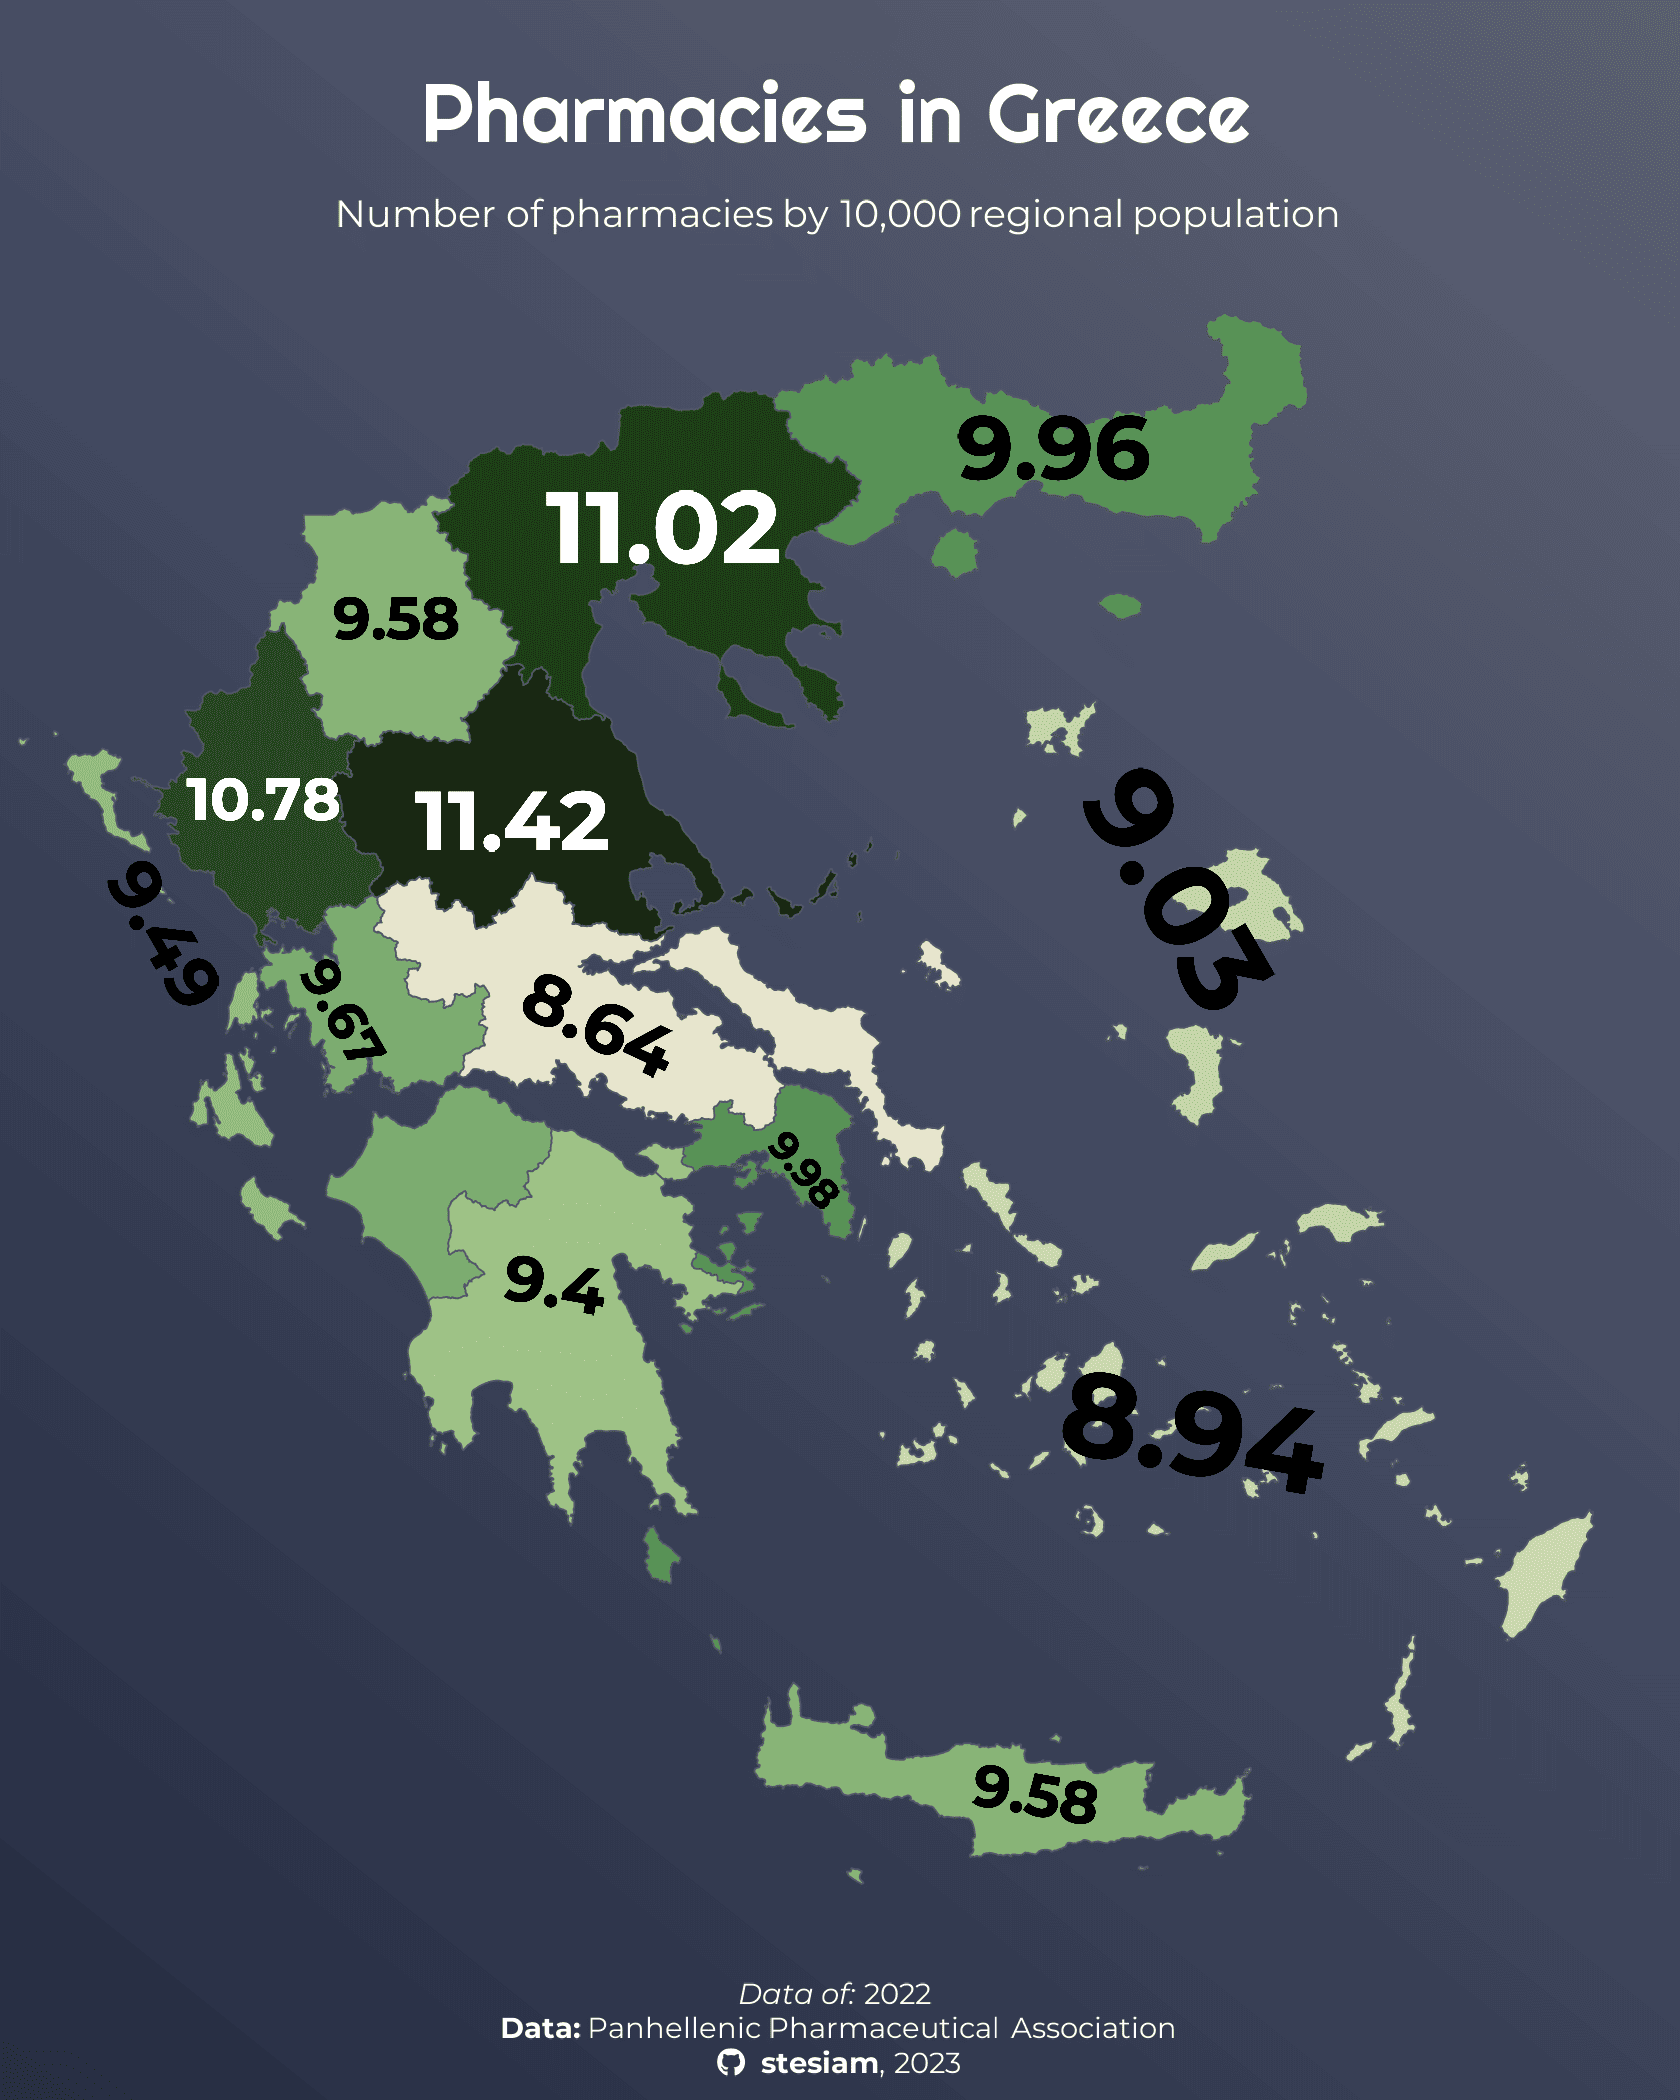
Map of Greece showing pharmacies per 10,000 residents by region in 2022. Thessaly (11.42) and Central Macedonia (11.02) have the most, Central Greece (8.64) and the South Aegean (8.94) the fewest.
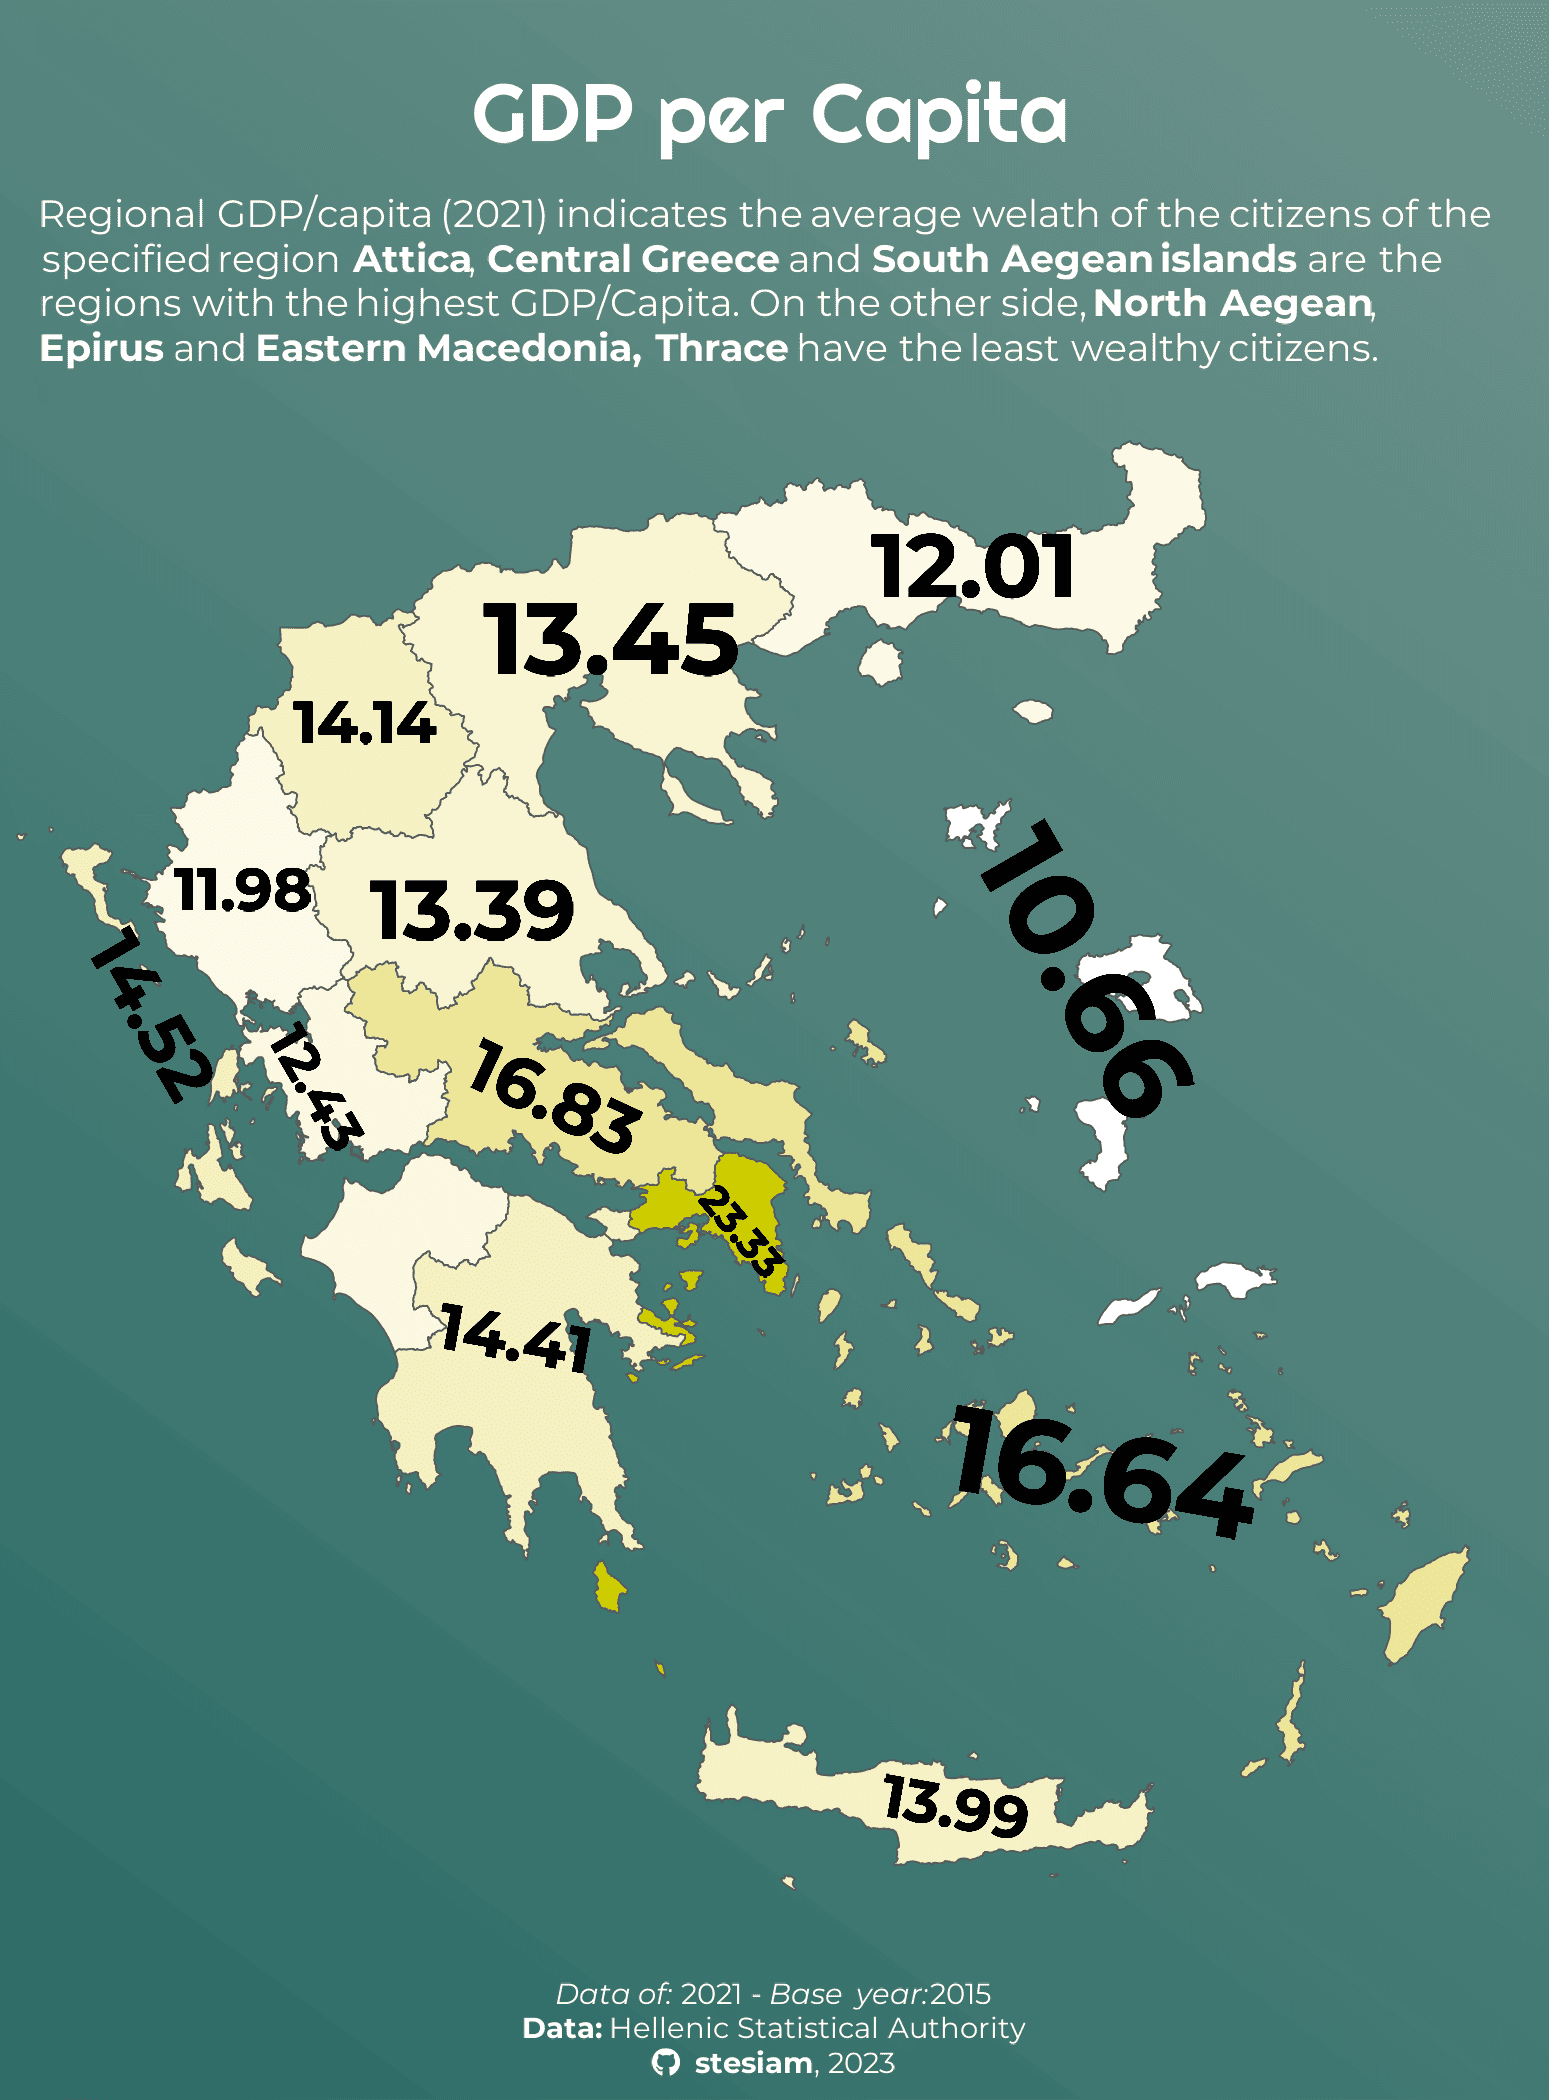
Map of Greece showing GDP per capita by region in 2021. Highest in Attica (23.33), Central Greece and the South Aegean, lowest in the North Aegean (10.66), Epirus and Eastern Macedonia and Thrace.
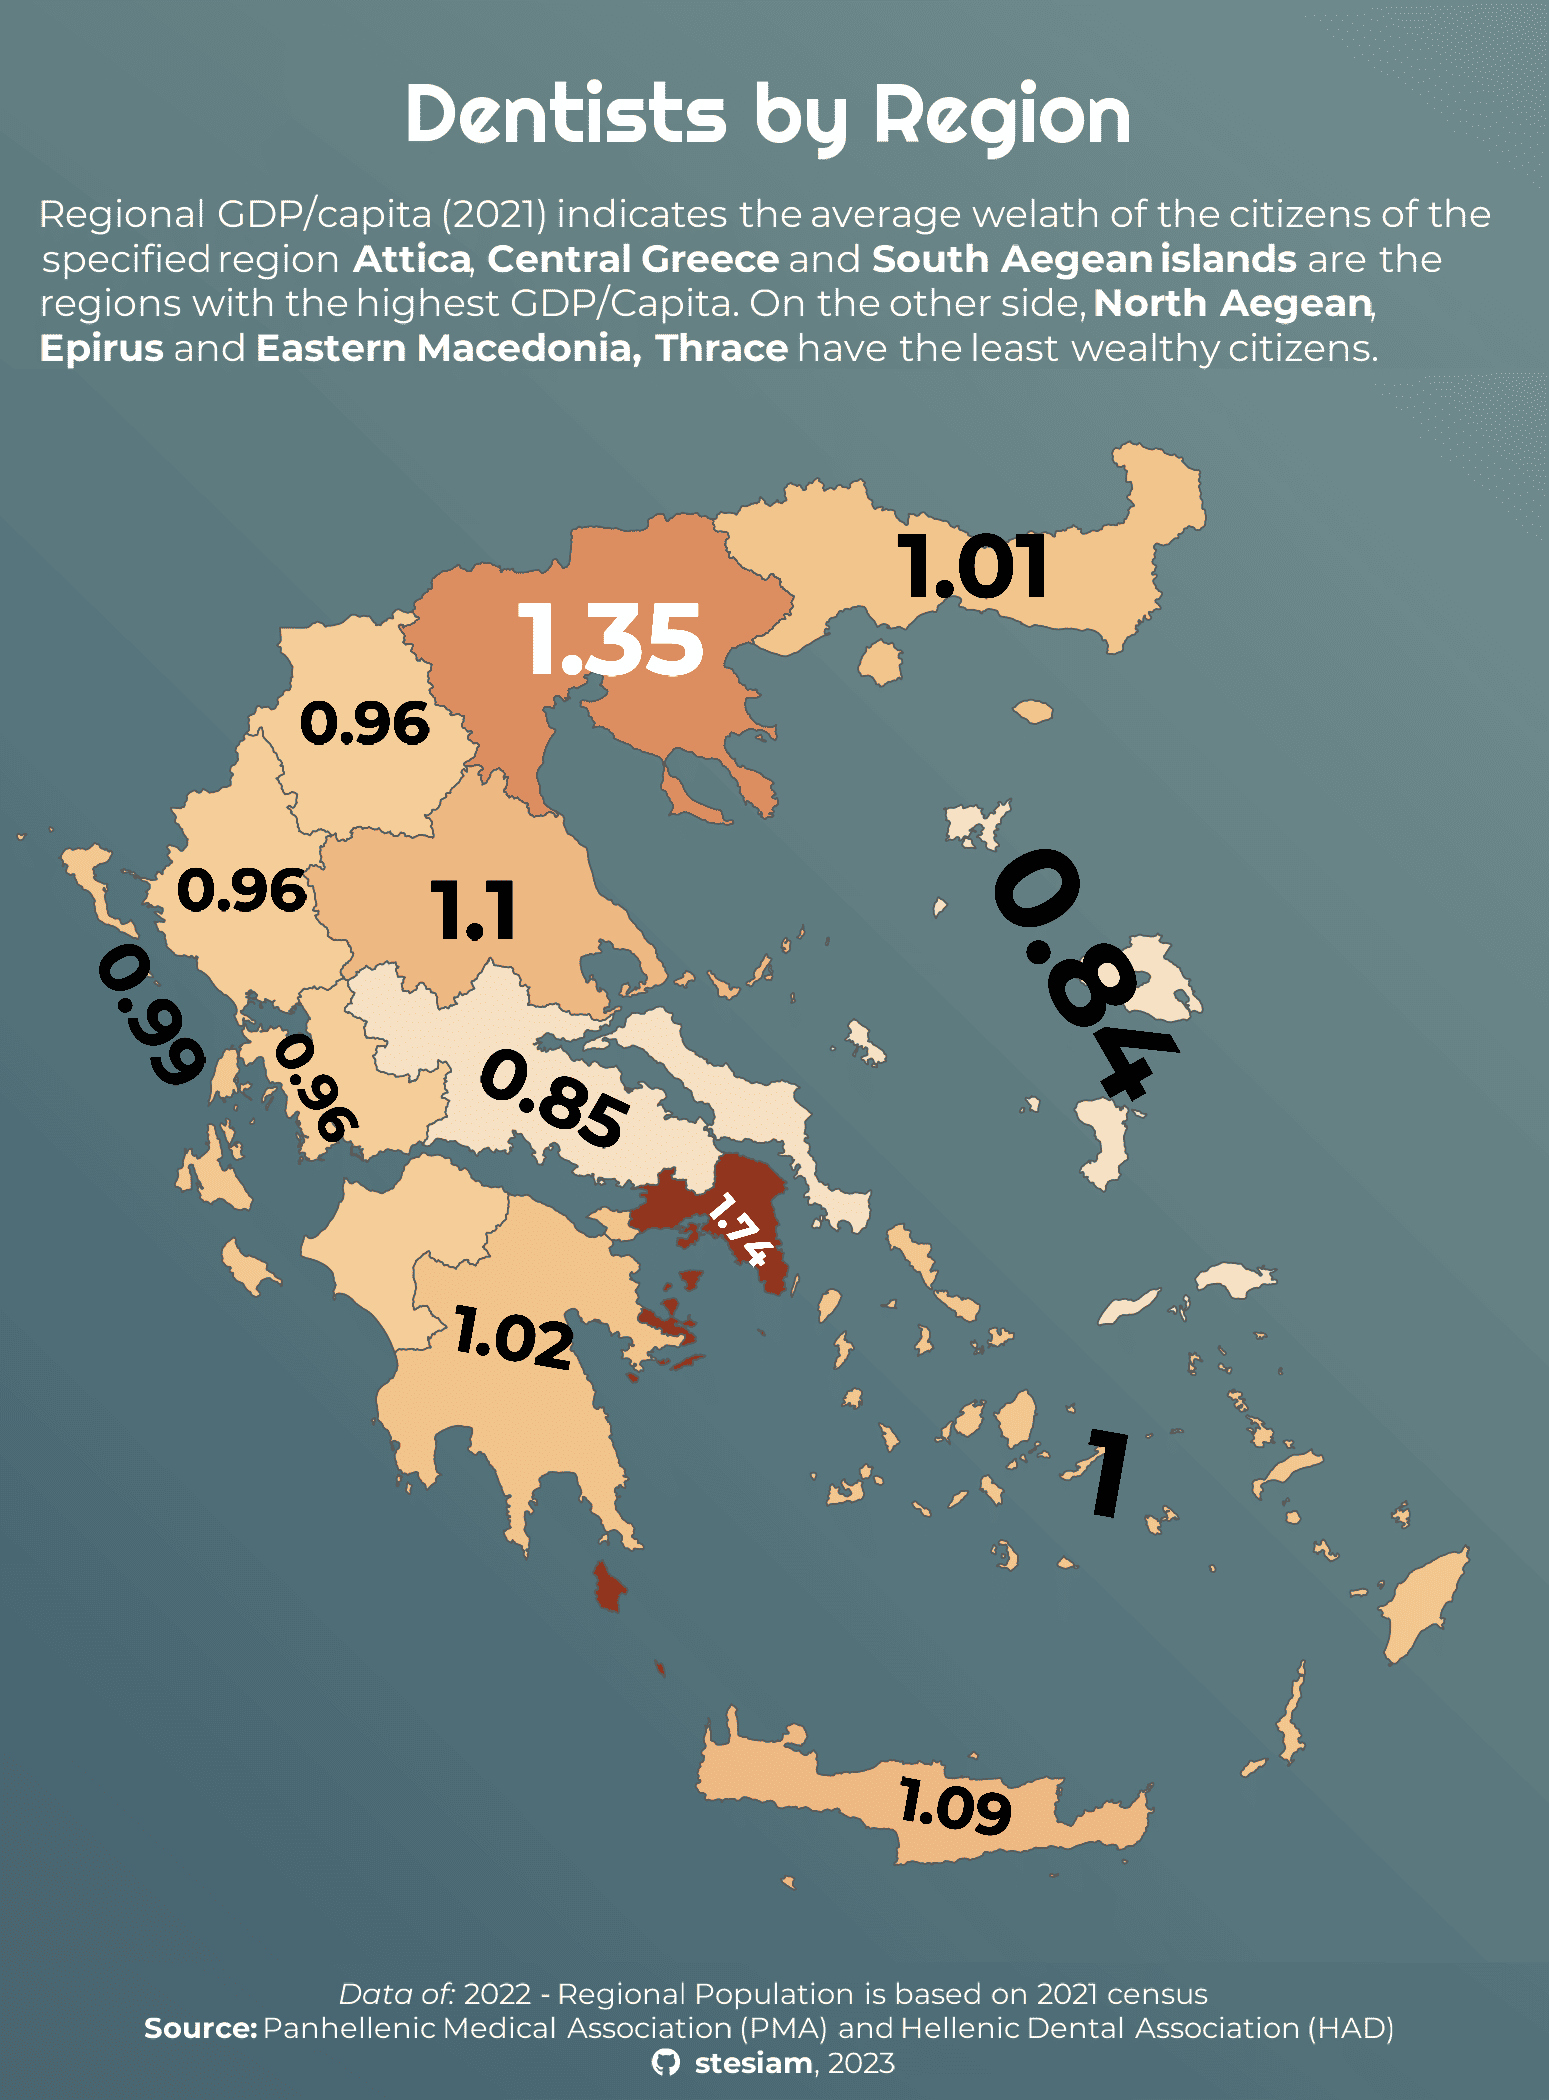
Map of Greece showing dentists by region in 2022. Attica (1.74) and Central Macedonia (1.35) have the most, the North Aegean (0.84) and Central Greece (0.85) the fewest.
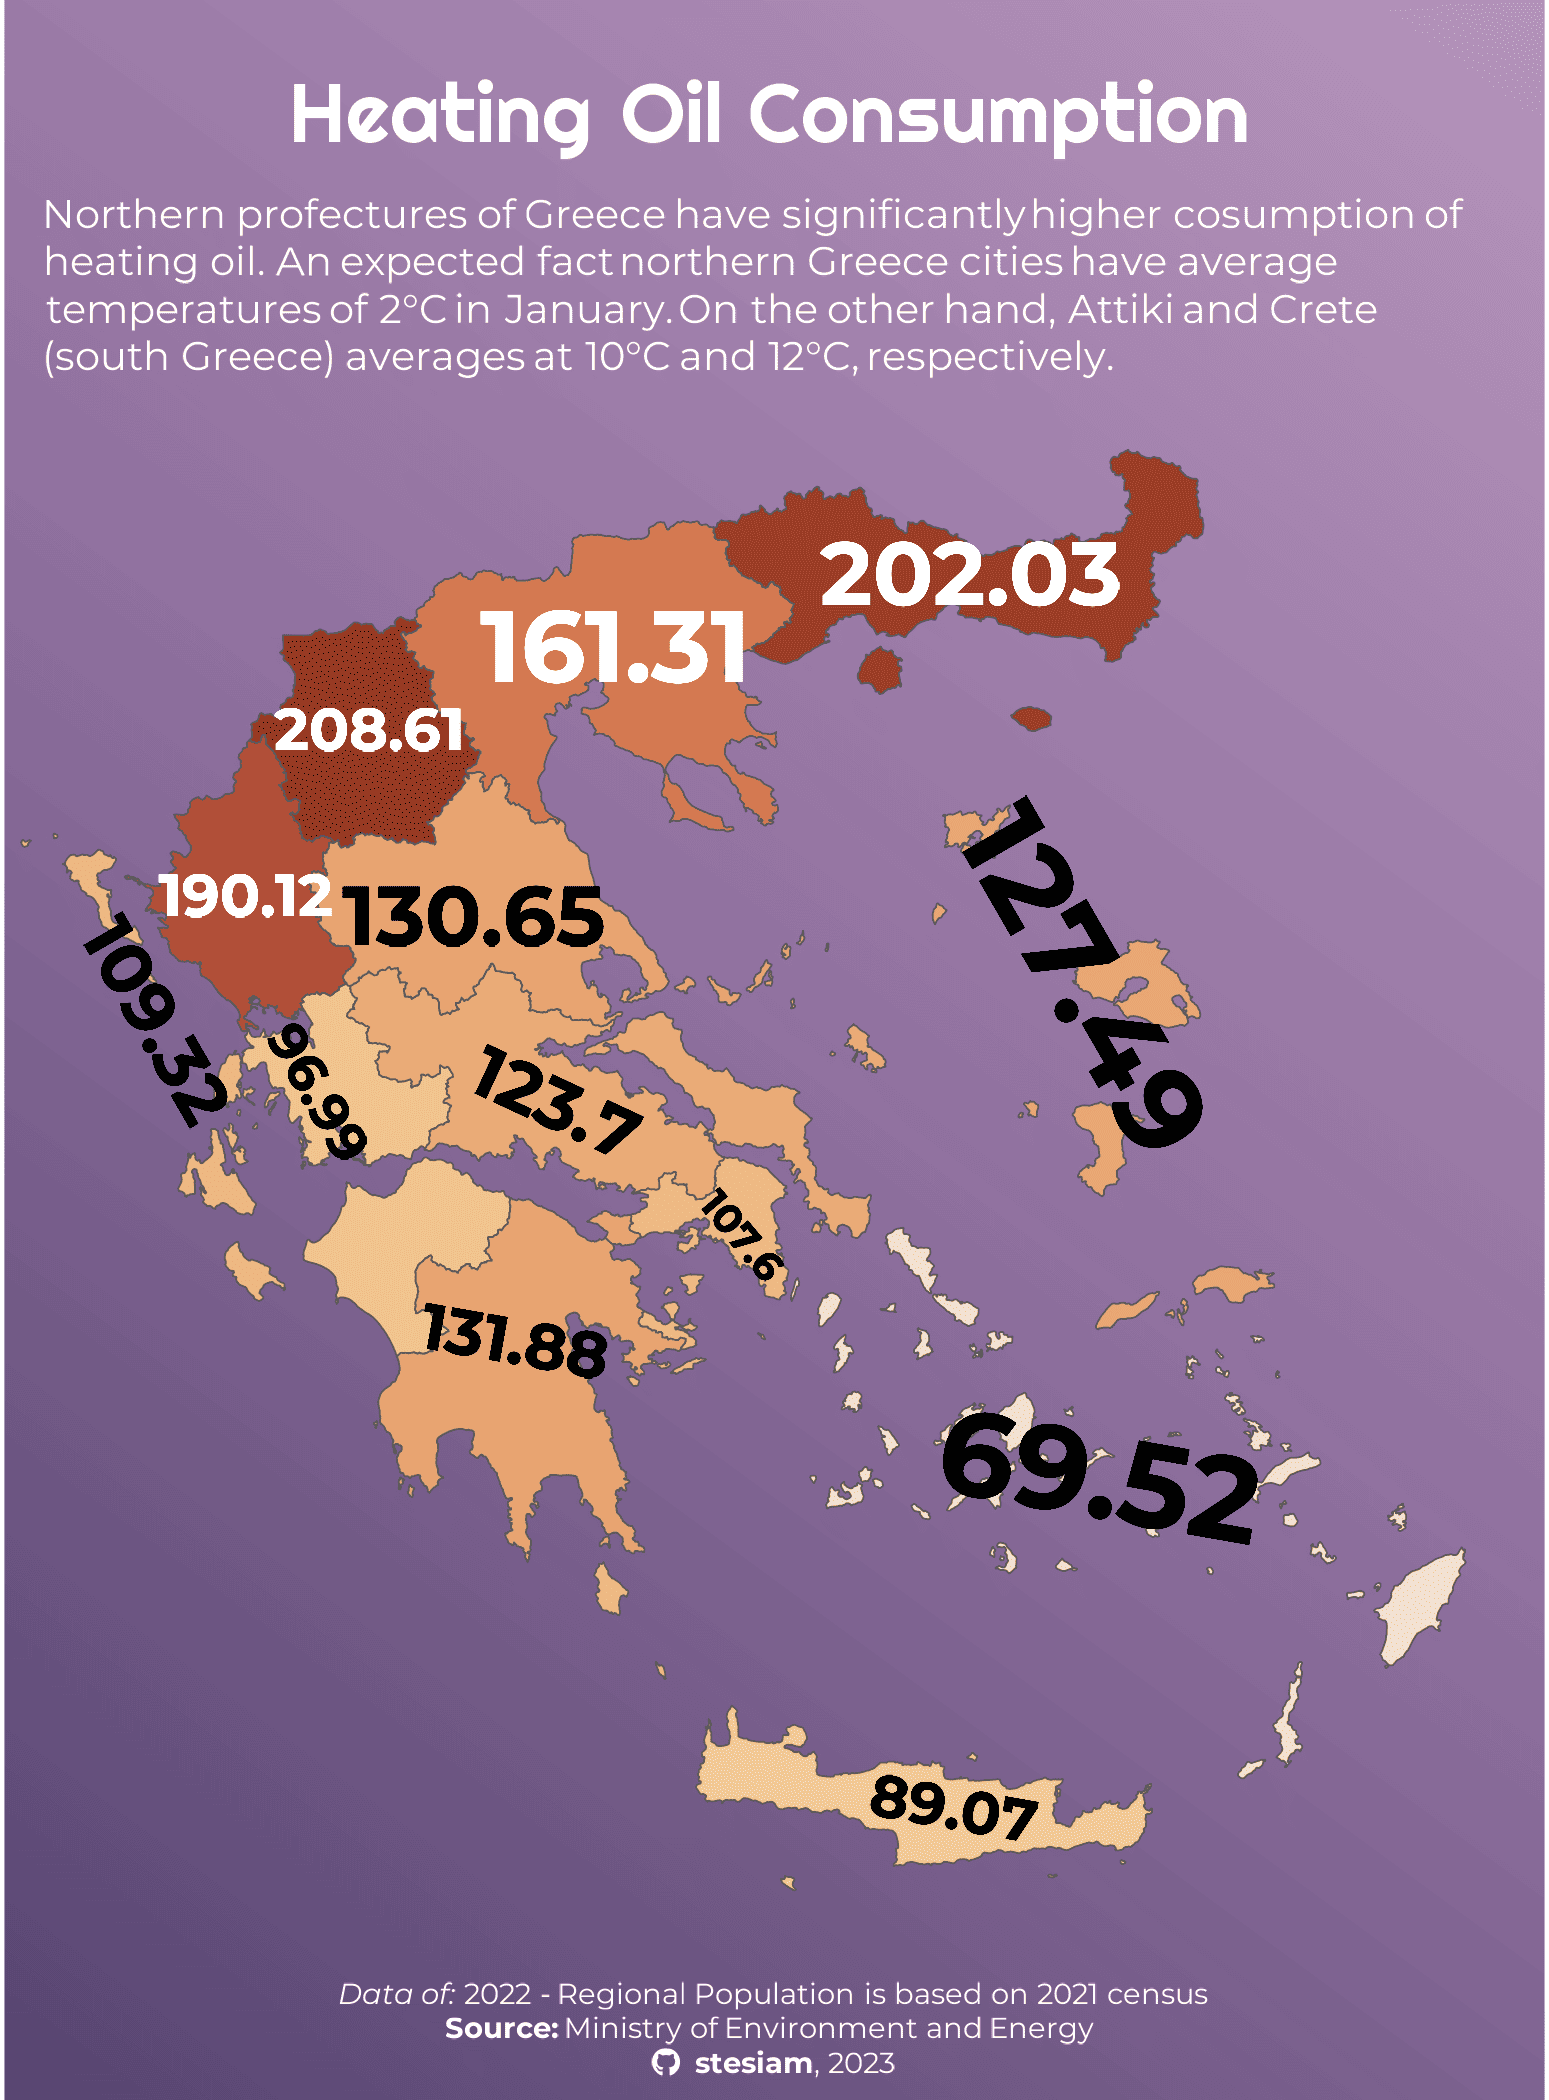
Map of Greece showing heating oil consumption by region in 2022. Highest in the northern regions, led by Western Macedonia (208.61), and lowest in the South Aegean (69.52) and Crete (89.07).
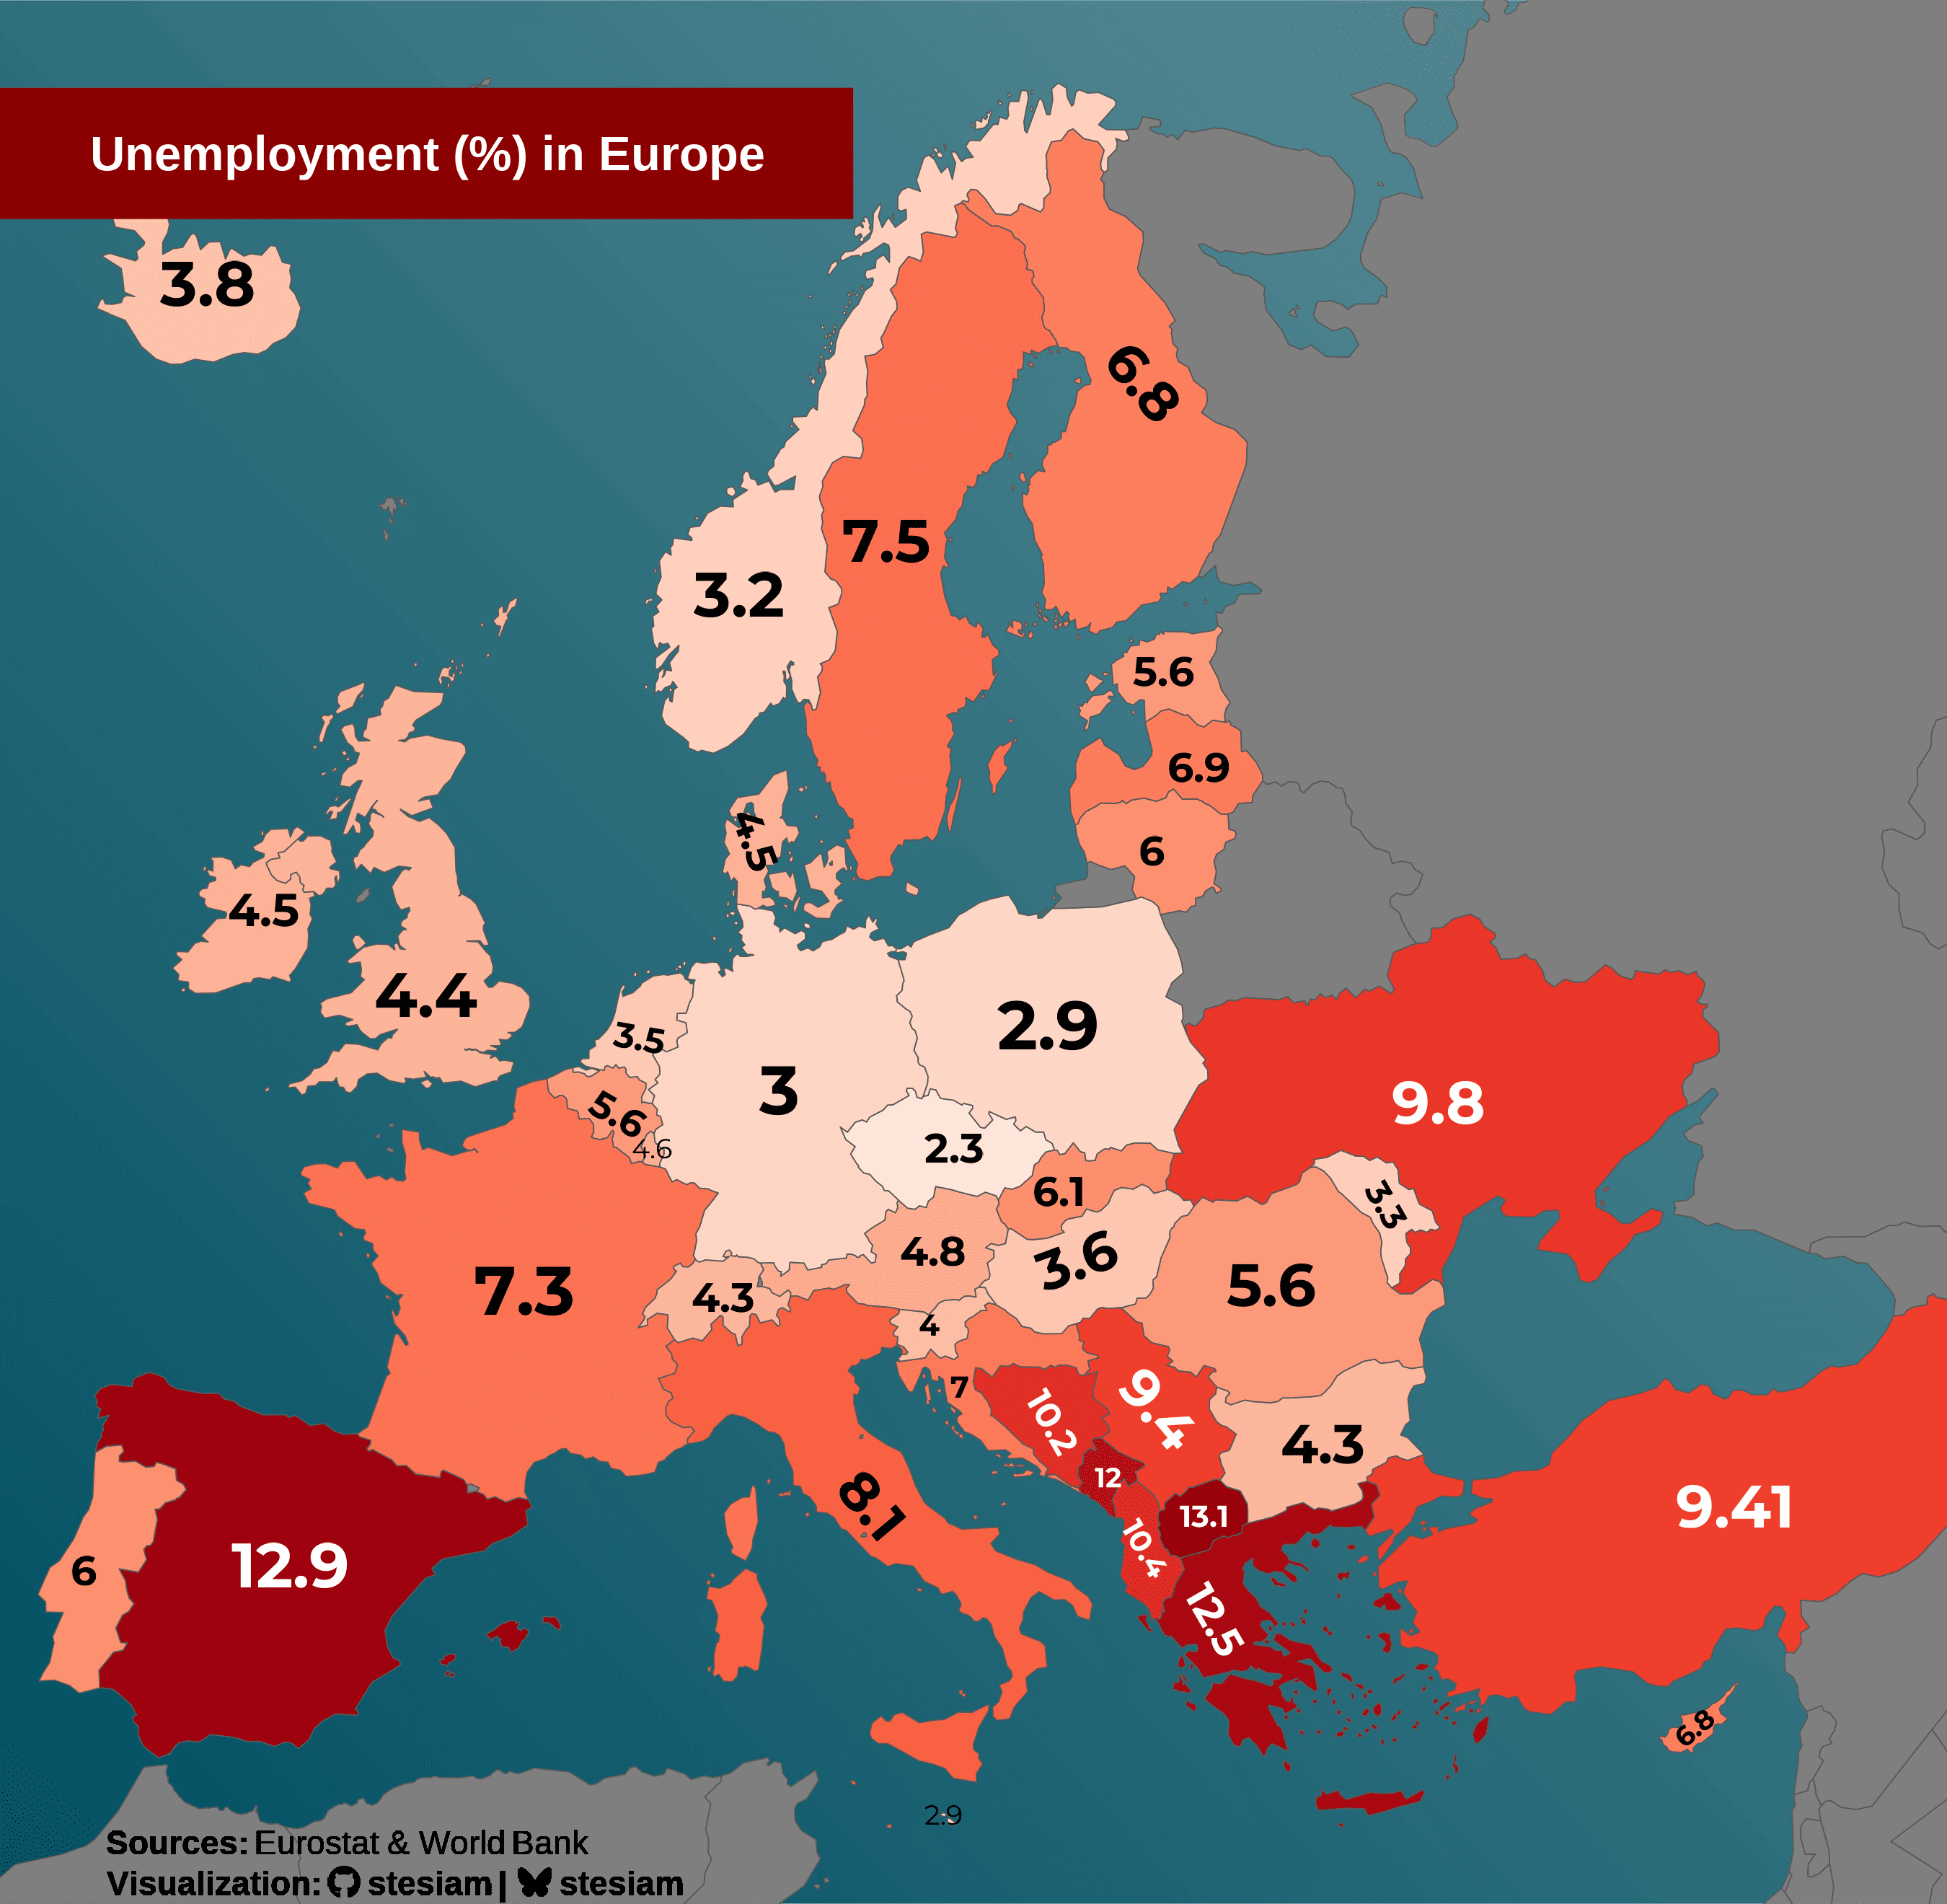
Map of Europe showing unemployment by country in 2022. Highest in North Macedonia (13.1%), Spain (12.9%) and Greece (12.5%), lowest in Czechia (2.3%), Poland and Germany (about 3%).
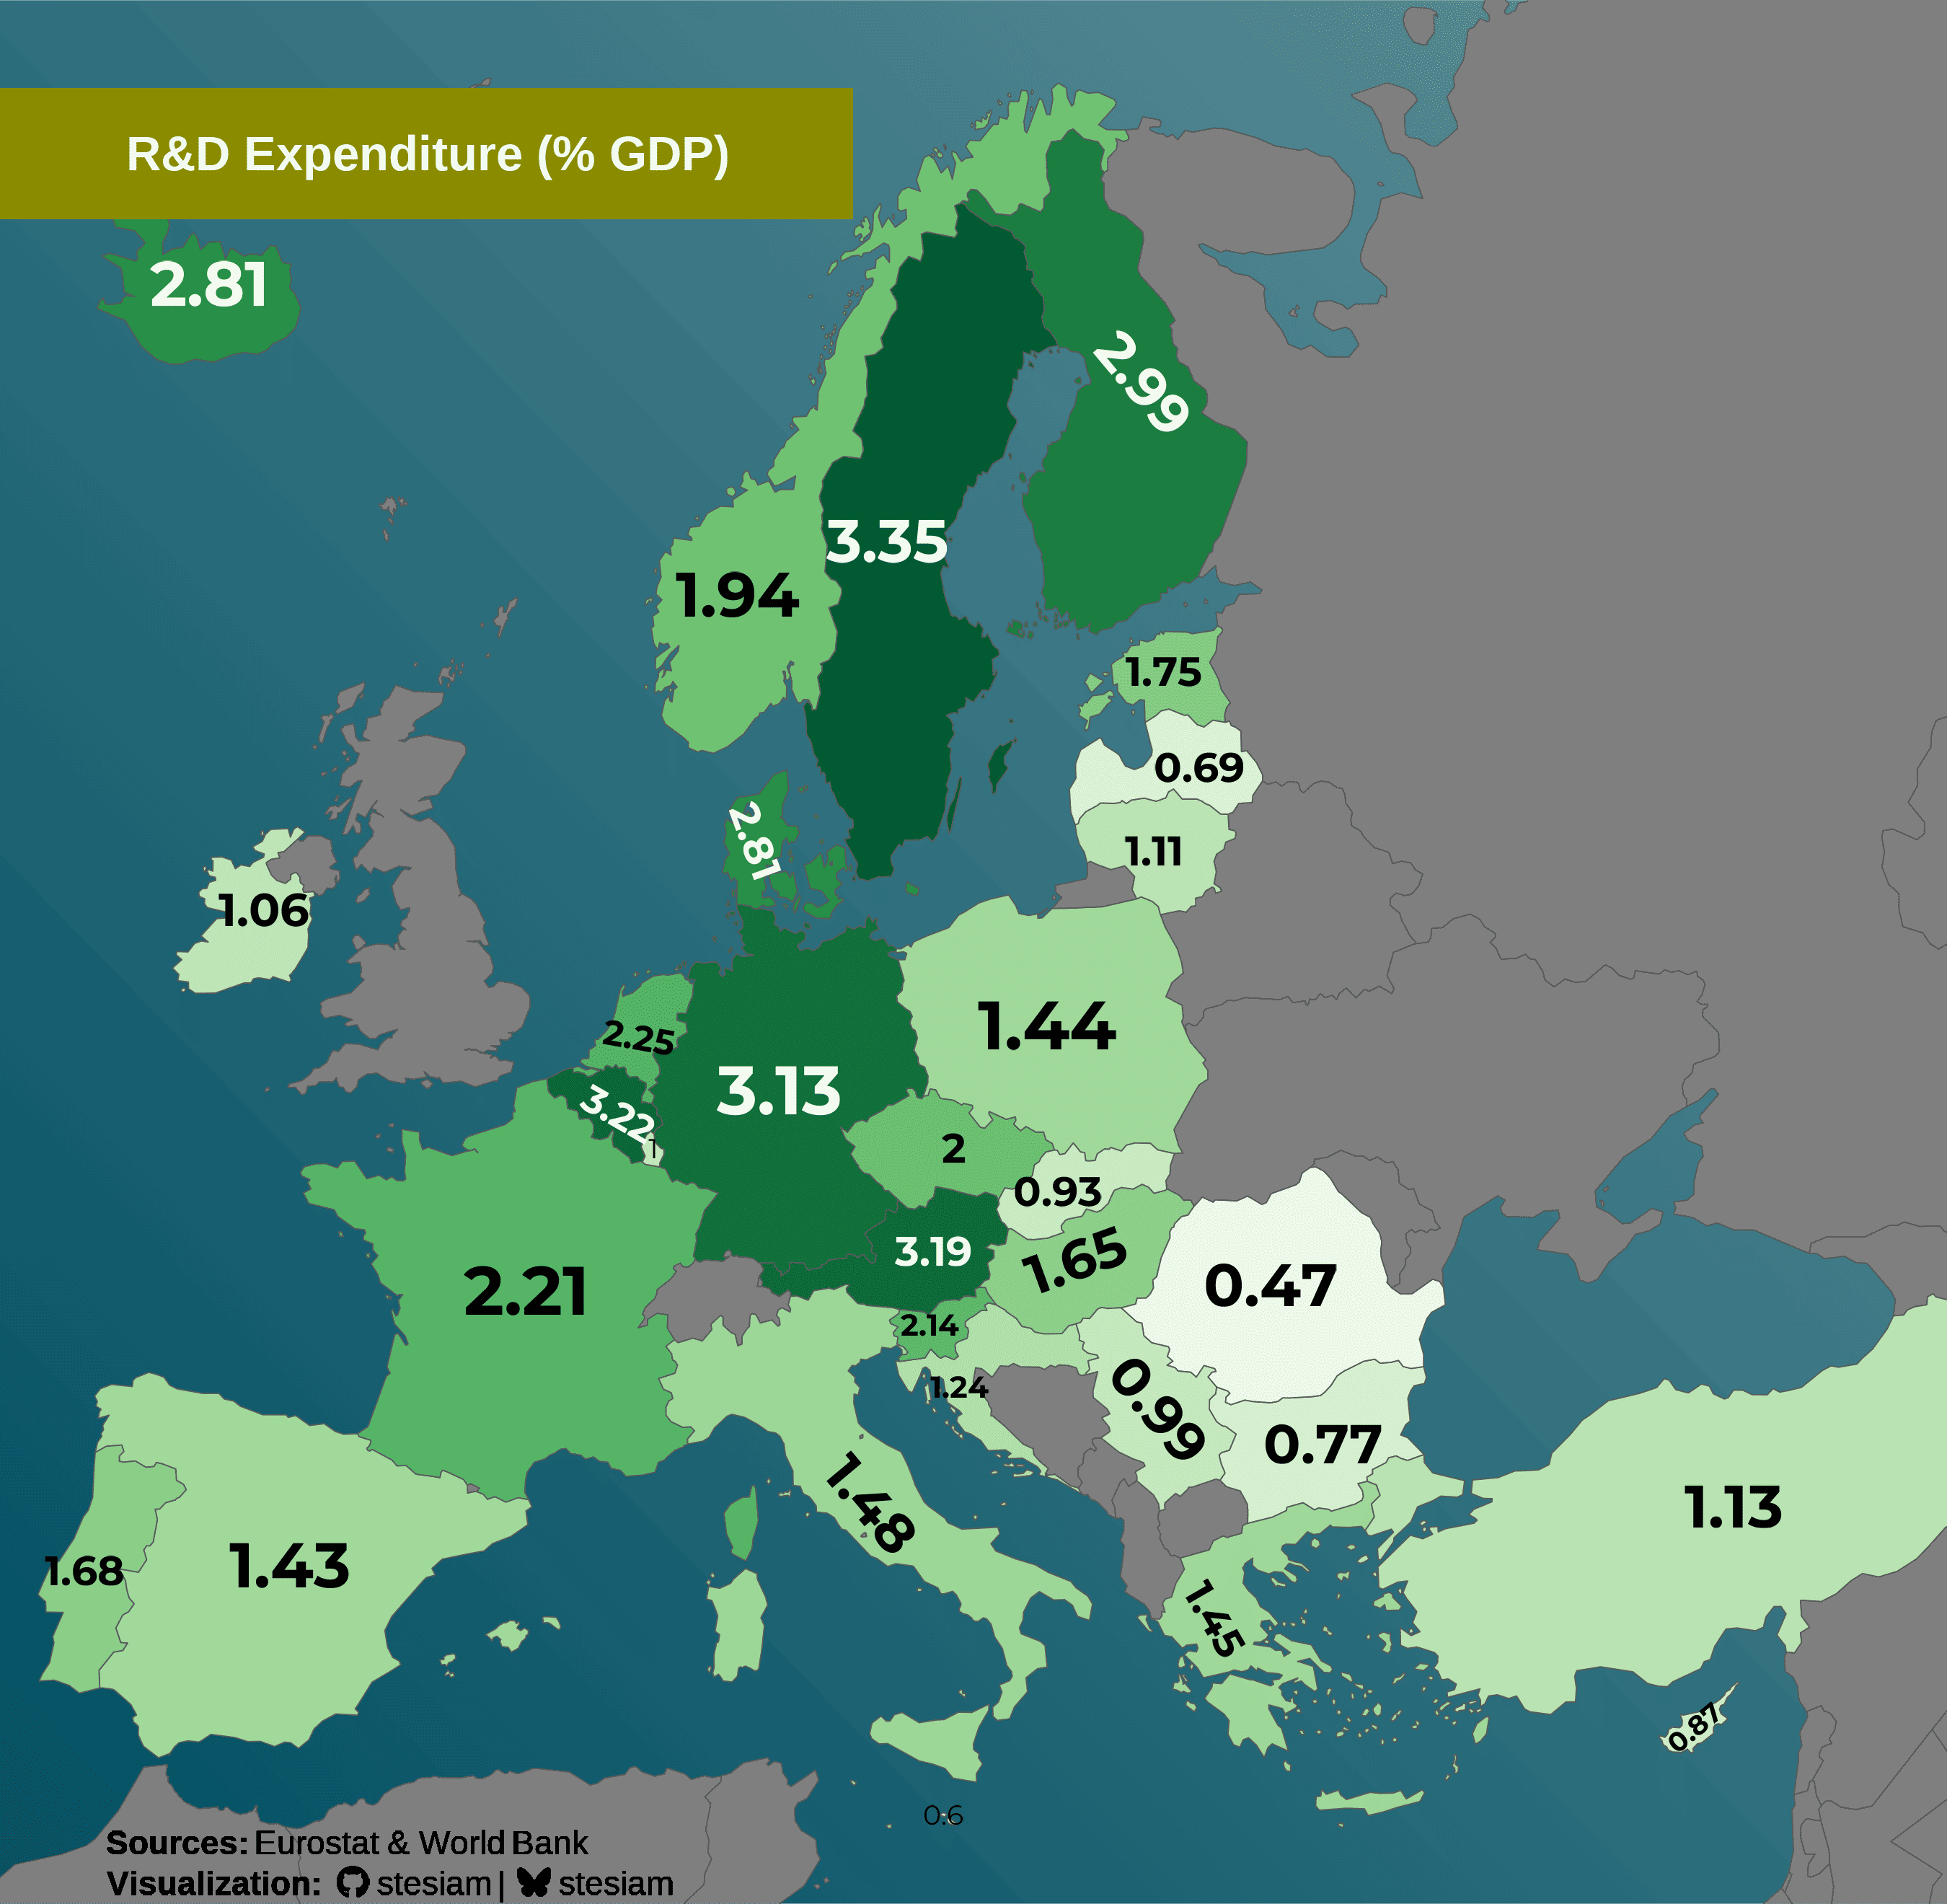
Map of Europe showing research and development spending as a share of GDP in 2021. Sweden (3.35%), Belgium, Austria and Germany lead, Romania (0.47%) is last. Greece is at 1.45%.
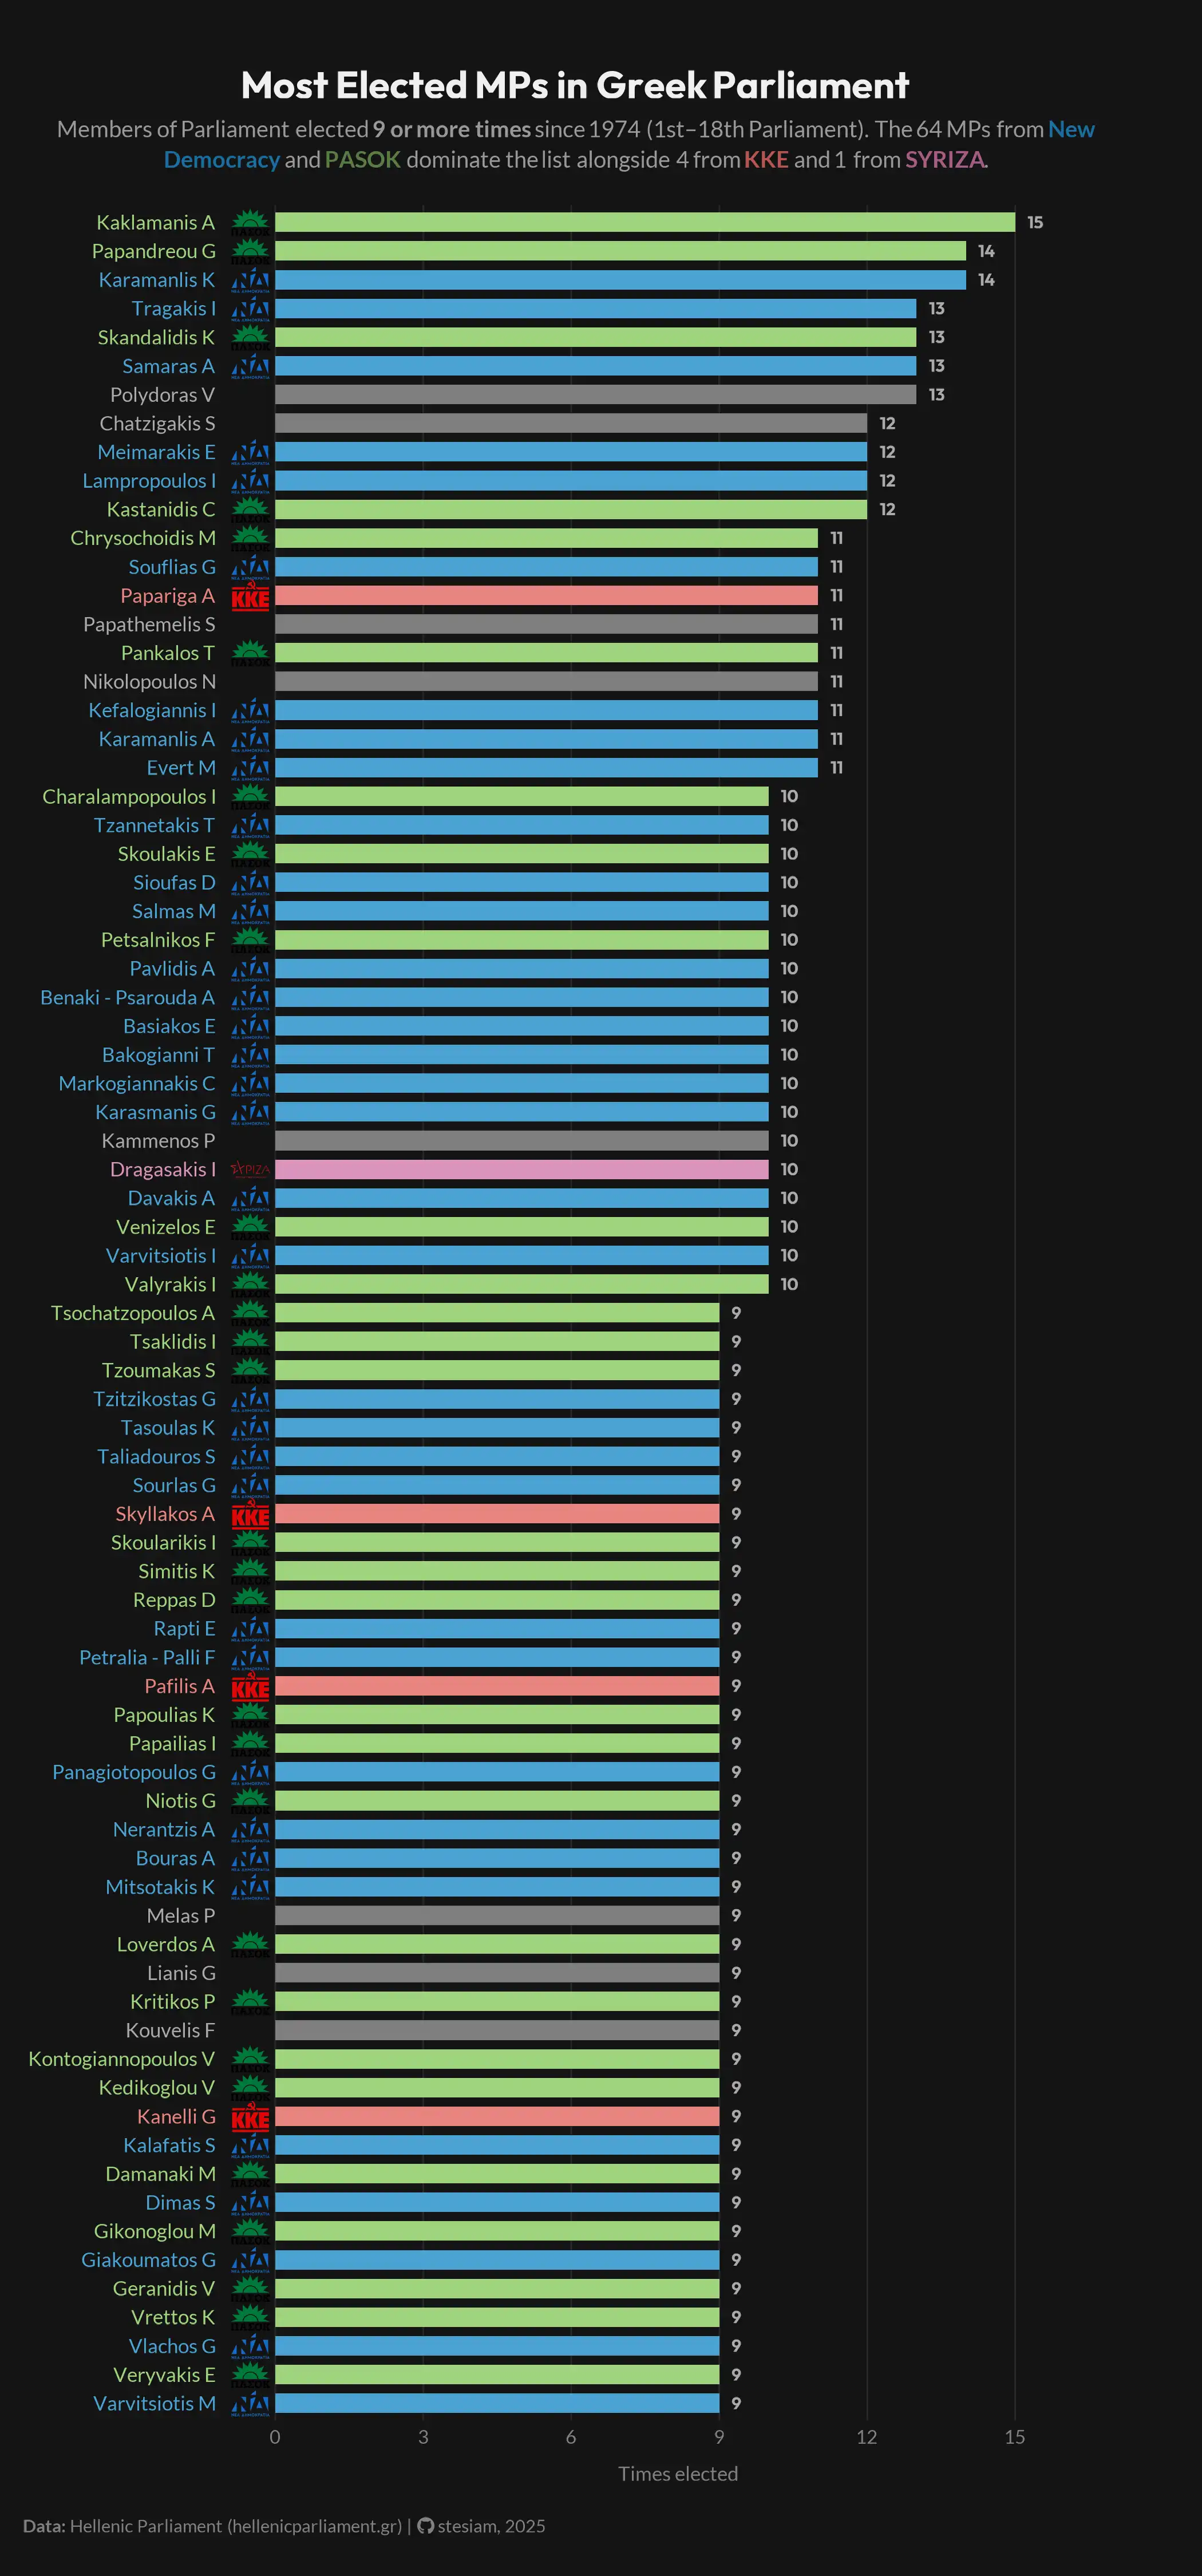
Bar chart of MPs elected 9 or more times since 1974. New Democracy and PASOK dominate, led by Konstantinos Karamanlis with 15 elections, and Georgios Papandreou and Kostas Karamanlis with 14.
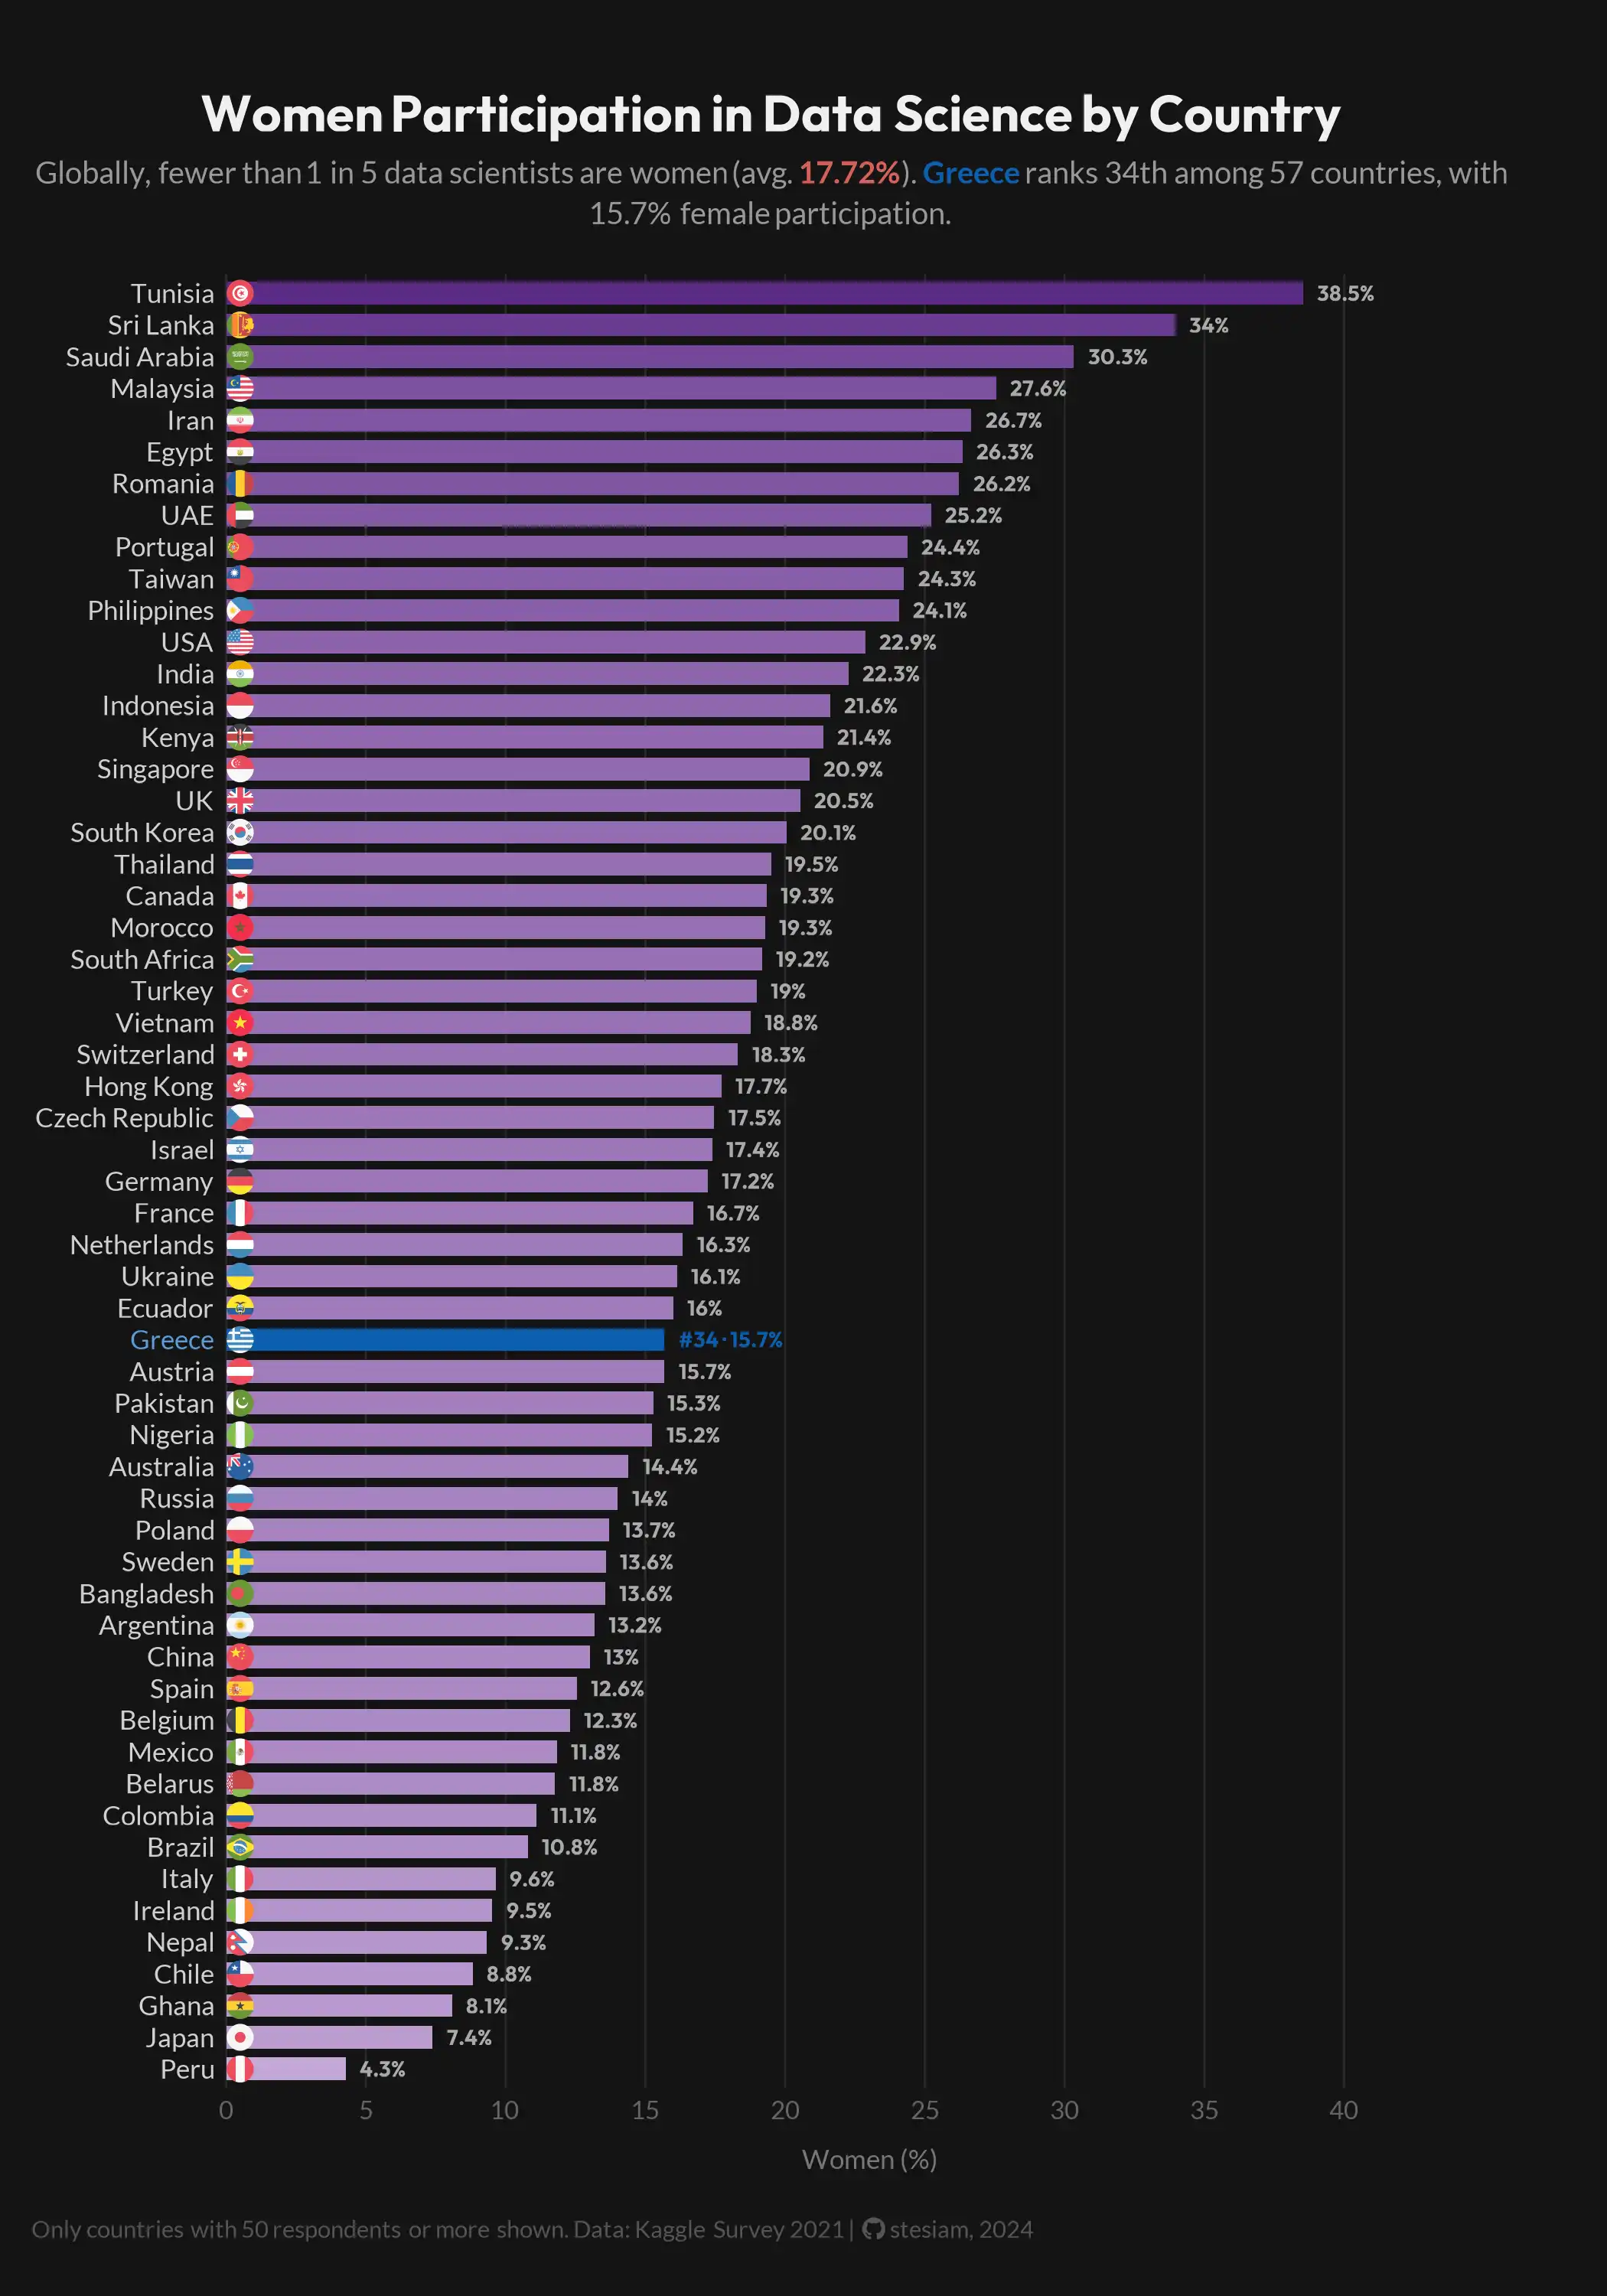
Bar chart of the share of women in data science by country, from the 2021 Kaggle survey. Worldwide, fewer than 1 in 5 are women. Tunisia leads (38.5%), and Greece ranks 34th of 57 countries with 15.7%.

Animations

Animated data visualizations and educational animations.

D3.js Kaggle ML & DS Survey · 2017–2023

Data Science Language Trends

Programming language usage trends in data science, 2017–2023. Python climbs to dominance while R and MATLAB steadily lose ground. Based on the Kaggle ML & DS Survey (approximate).