About this Website
The story of the site and its tools.
The story of this site
How the site started and how it changed.
- 2018
From SPSS to R
My move from a program full of limitations to a programming language with unlimited possibilities for statistical analysis. The spark came in my student years, when I was looking for free alternatives. The well-known book R for Data Science played a big part in my choice.
- June 2019
A GitHub account
Where the code and data of my projects have lived ever since.
- Late 2021
Starting with Distill
Distill helped me build my first website without knowing HTML and CSS. I wrote in R Markdown, text and code together, and the package did the rest. It is considered the predecessor of Quarto.
- July 2022
Moving to Quarto
I switched to Quarto, the successor to Distill, which offered more options for the look of the site. GitHub Pages hosted it for free. I also got my first (unofficial) logo, which was a chart from my project on ageing in 2022, made with the ggplot2 package.
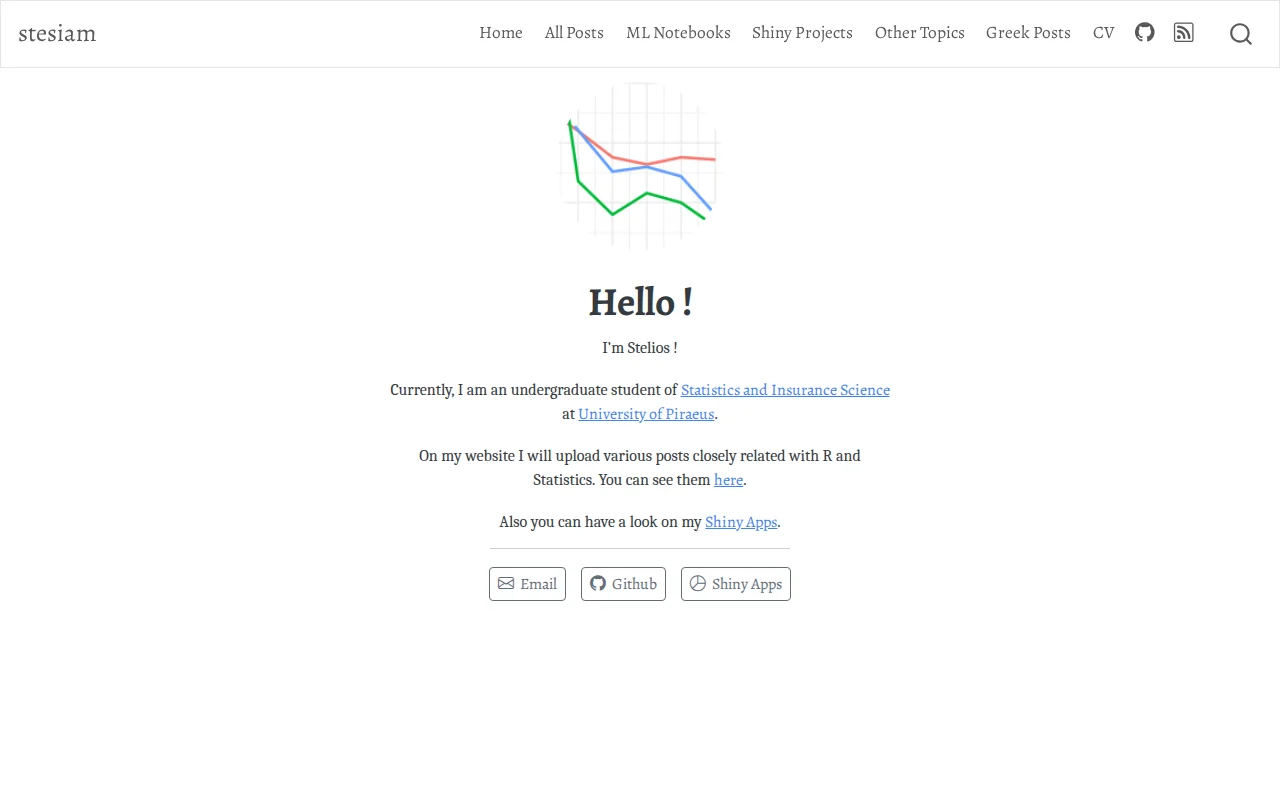
The home page, July 2022 - September 2022
- October 2022
My first public dataset
Members of the Hellenic Parliament from 1981 to 2019.
- November 2022
30DayMapChallenge
The 30DayMapChallenge gave me a reason to make my first maps in R. Each day of November has a different theme. I completed 10, but I don’t show them because they were terrible. If you want to laugh at the maps, they are on GitHub.
- February 2023
TidyTuesday
TidyTuesday provides a new dataset every week and everyone makes their own chart. I took part in several weeks and the charts are in the corresponding repository.
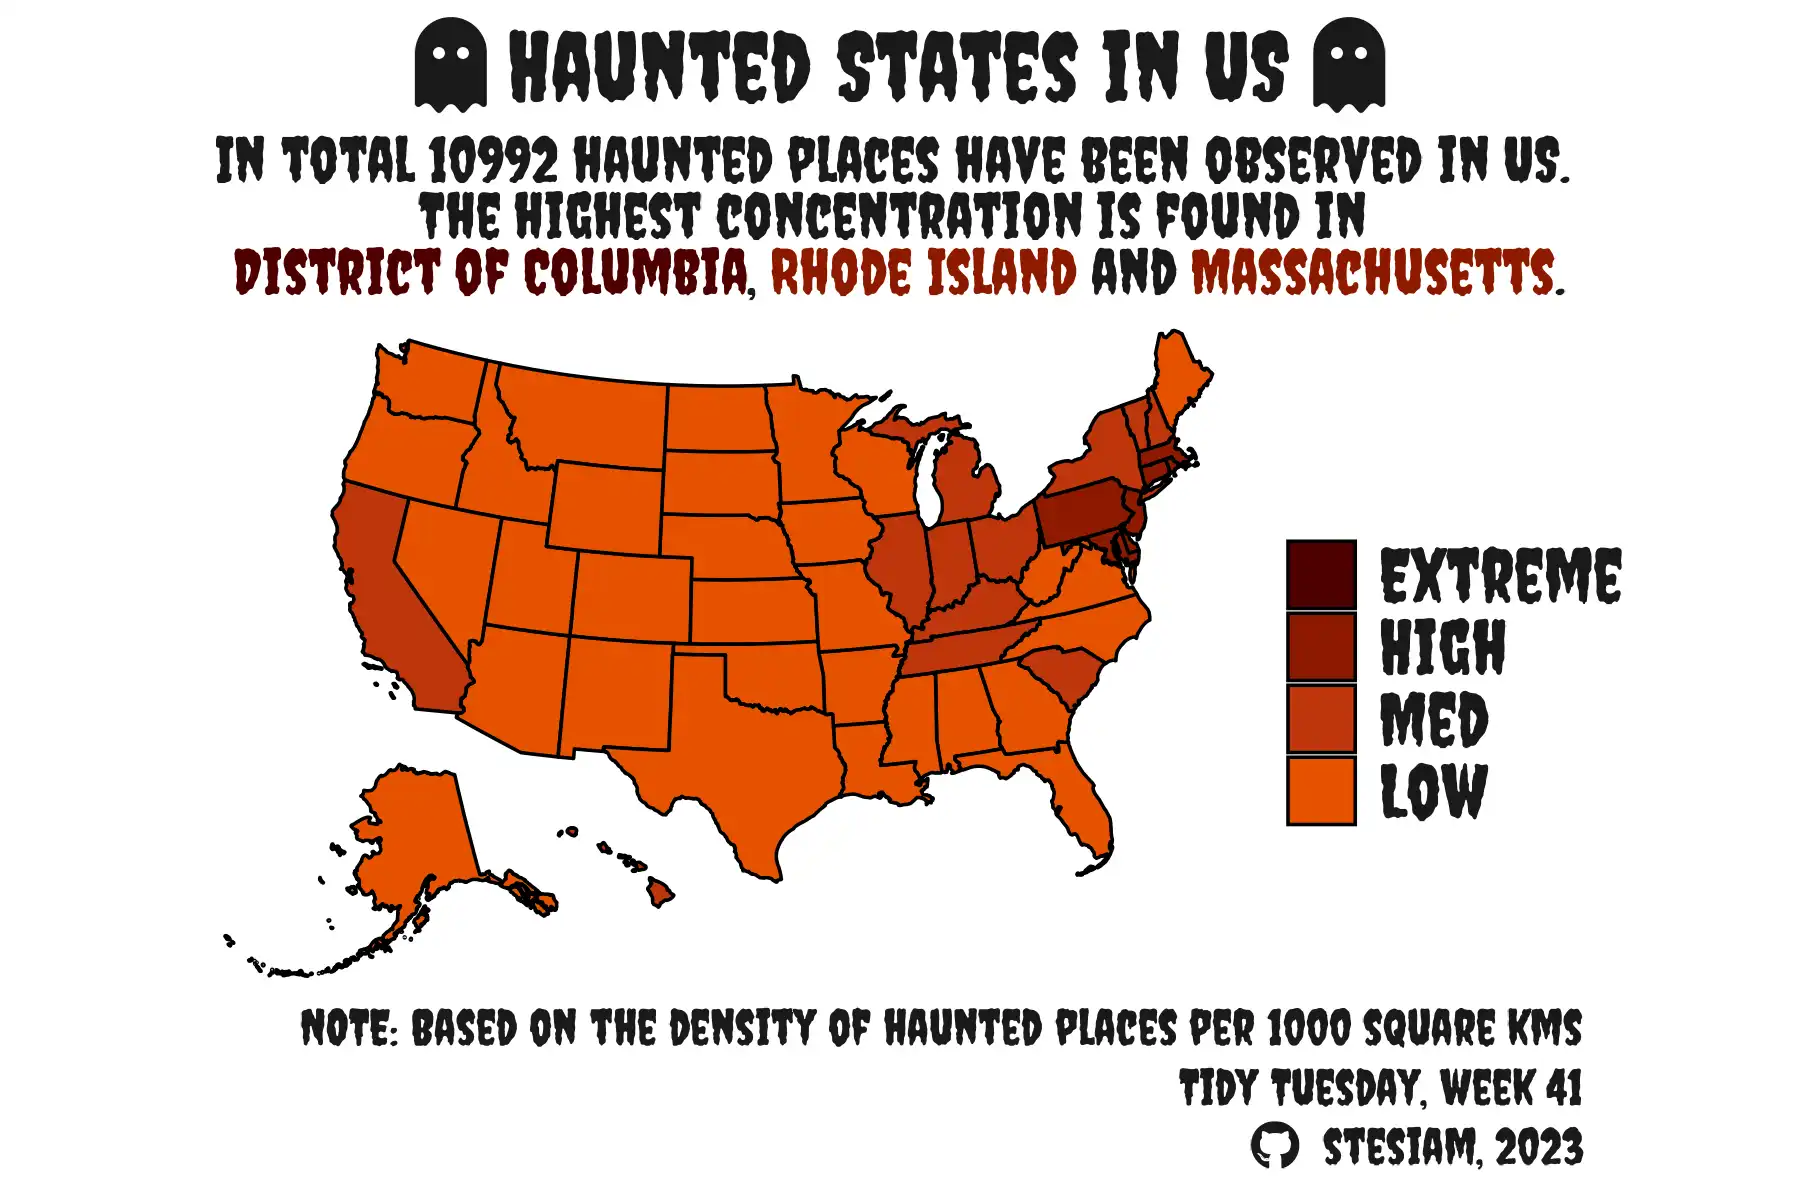
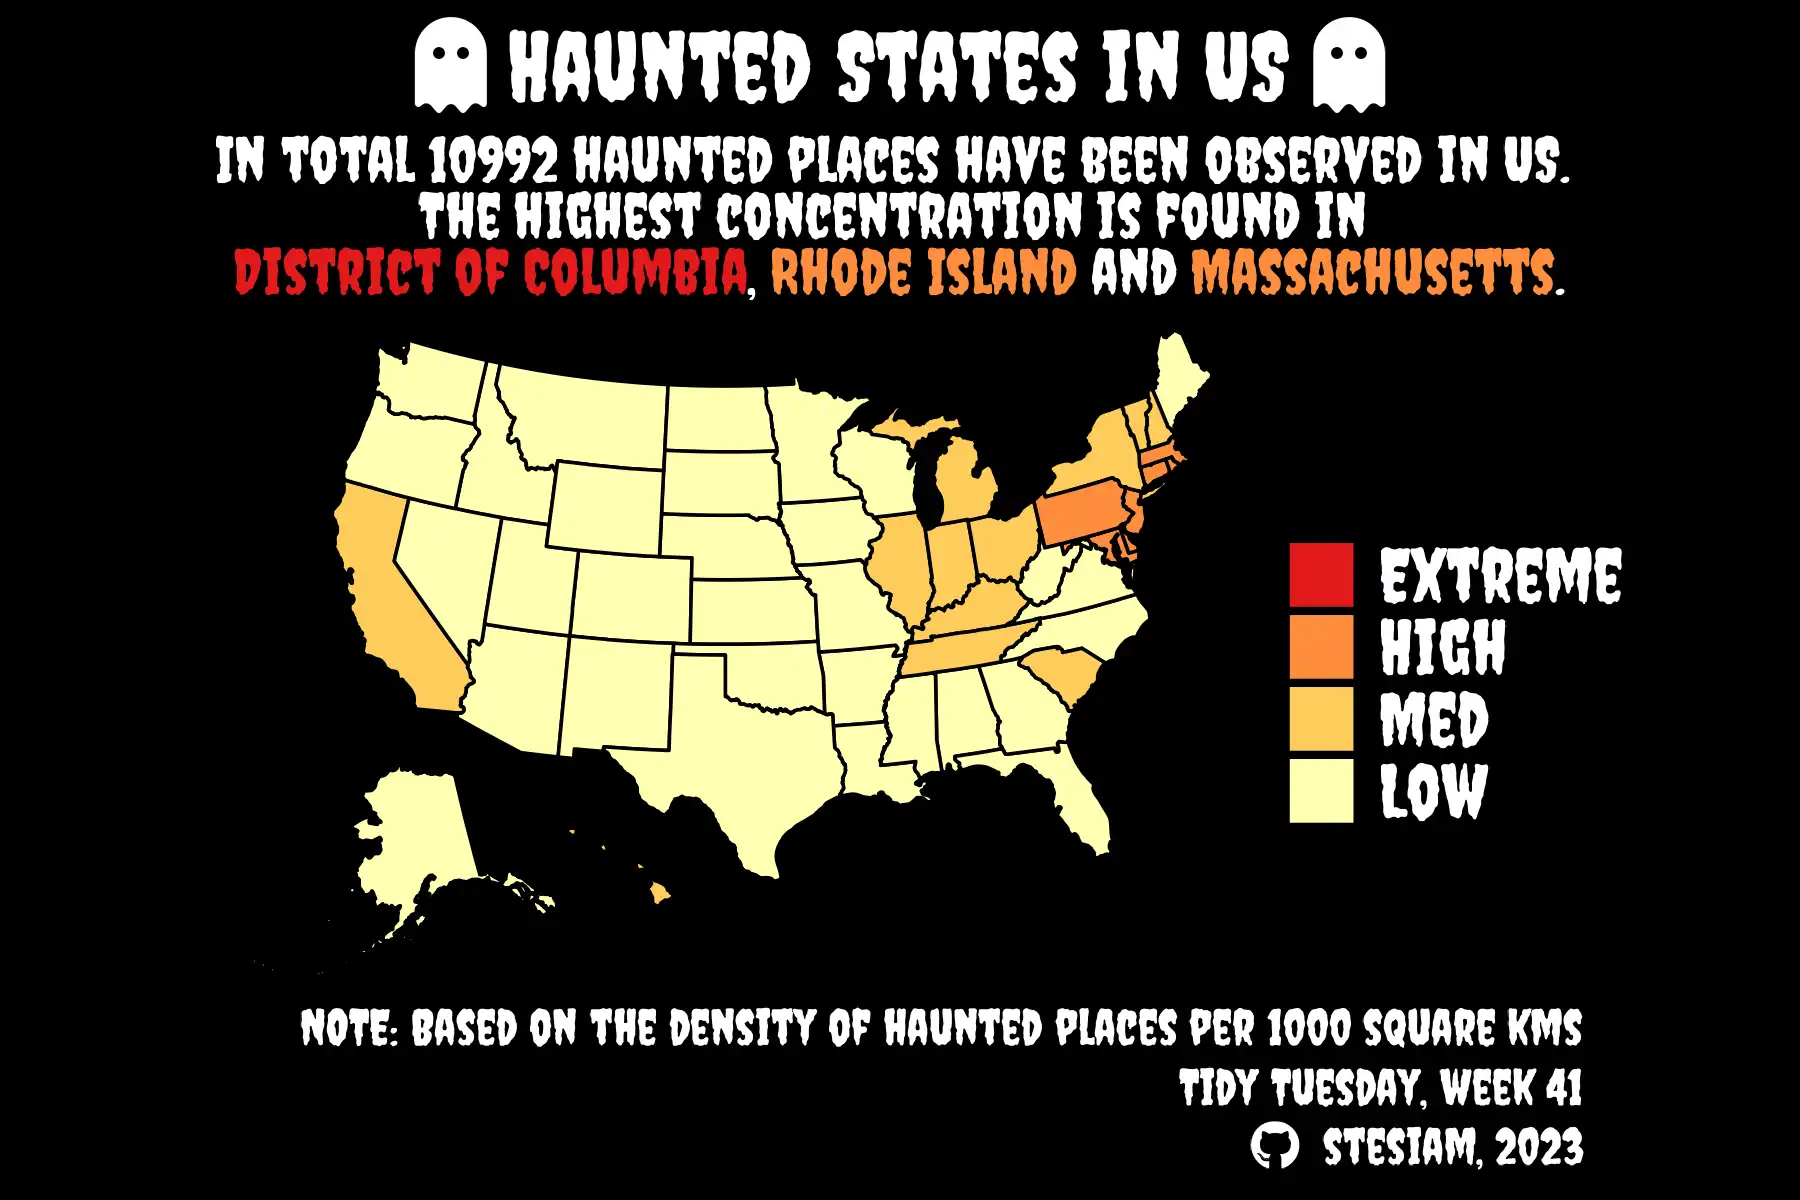
Haunted places in the US, TidyTuesday 2023, week 41 - April 2023
Registering stesiam.com
I bought stesiam.com on 11 April 2023 and the site moved there from GitHub’s free stesiam.github.io. Only the address changed. The site continued to be hosted for free on GitHub Pages.
- April 2024
30DayChartChallenge
The 30DayChartChallenge is a challenge with one chart a day for April, each day with a different theme. I took part on several days and the charts are in the corresponding repository.
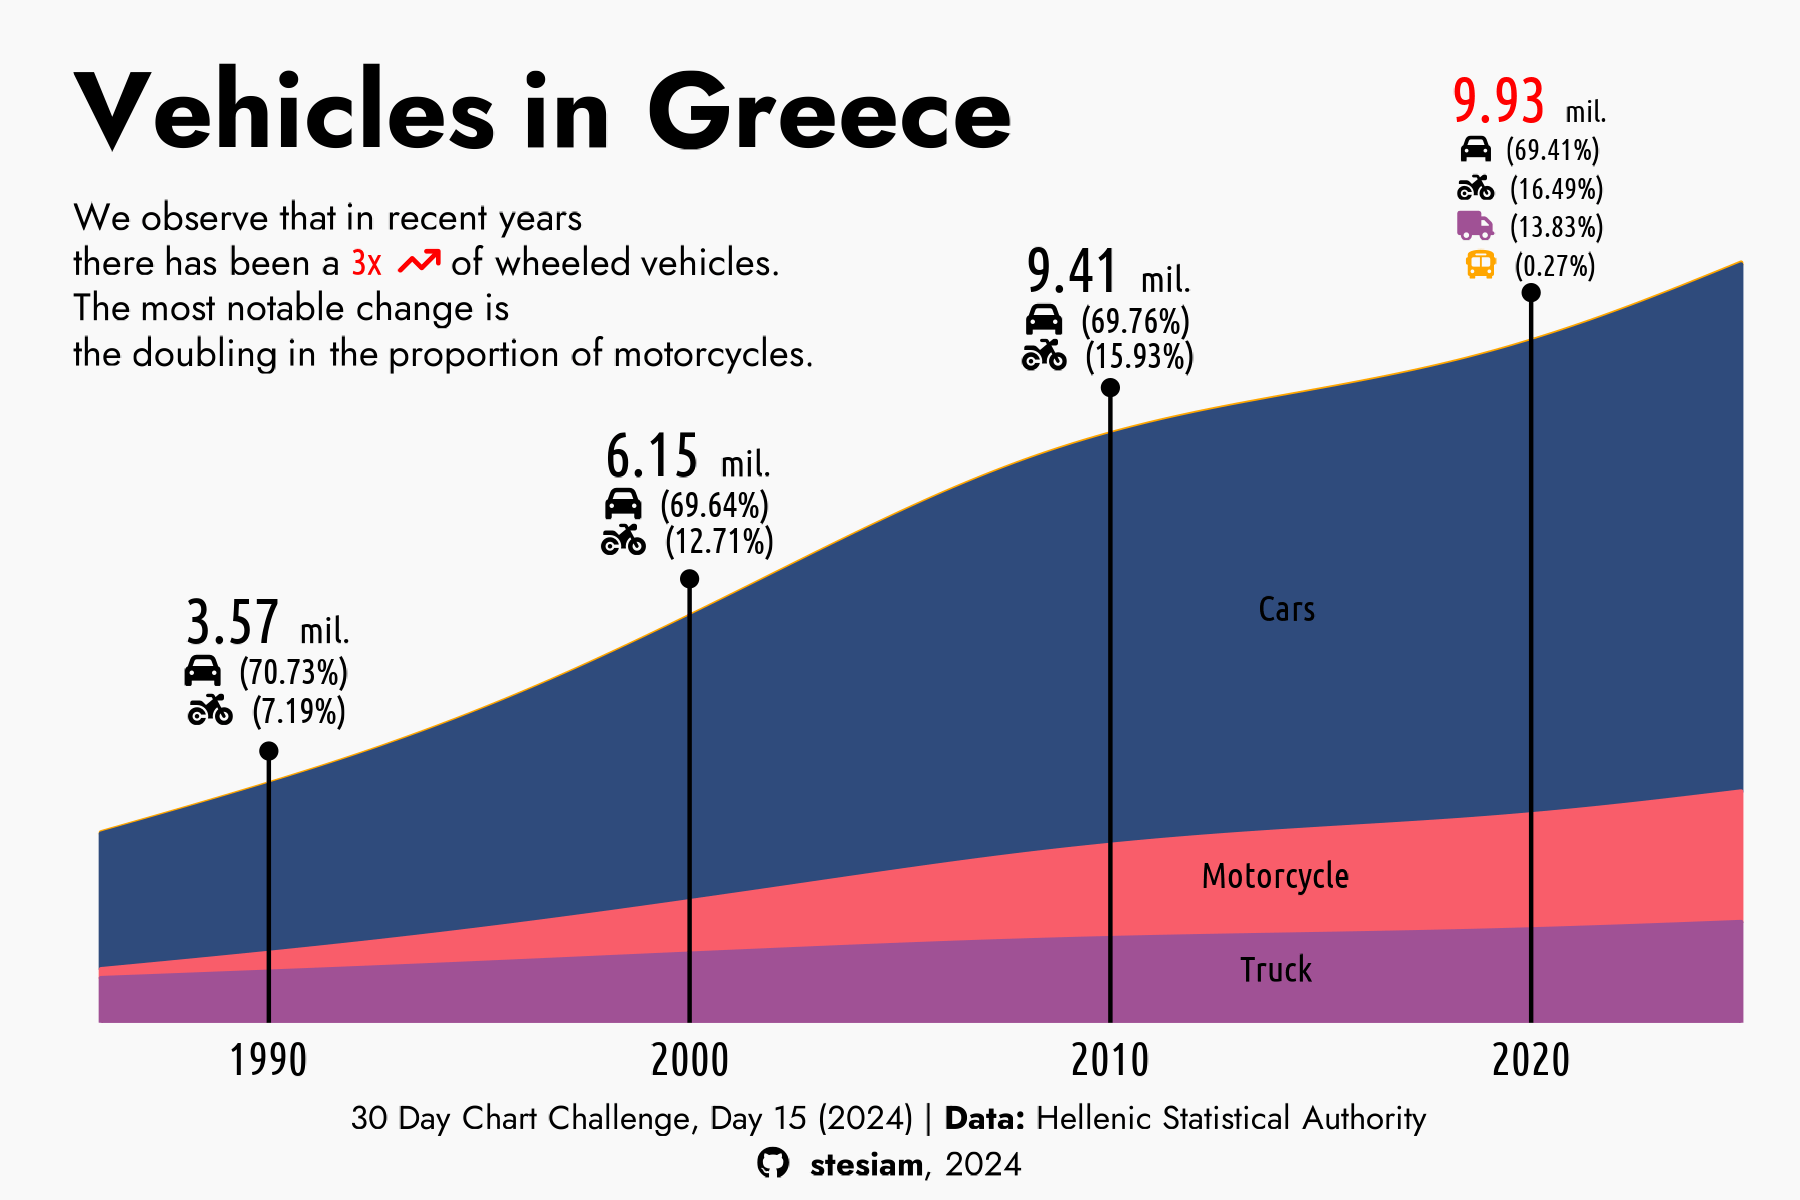
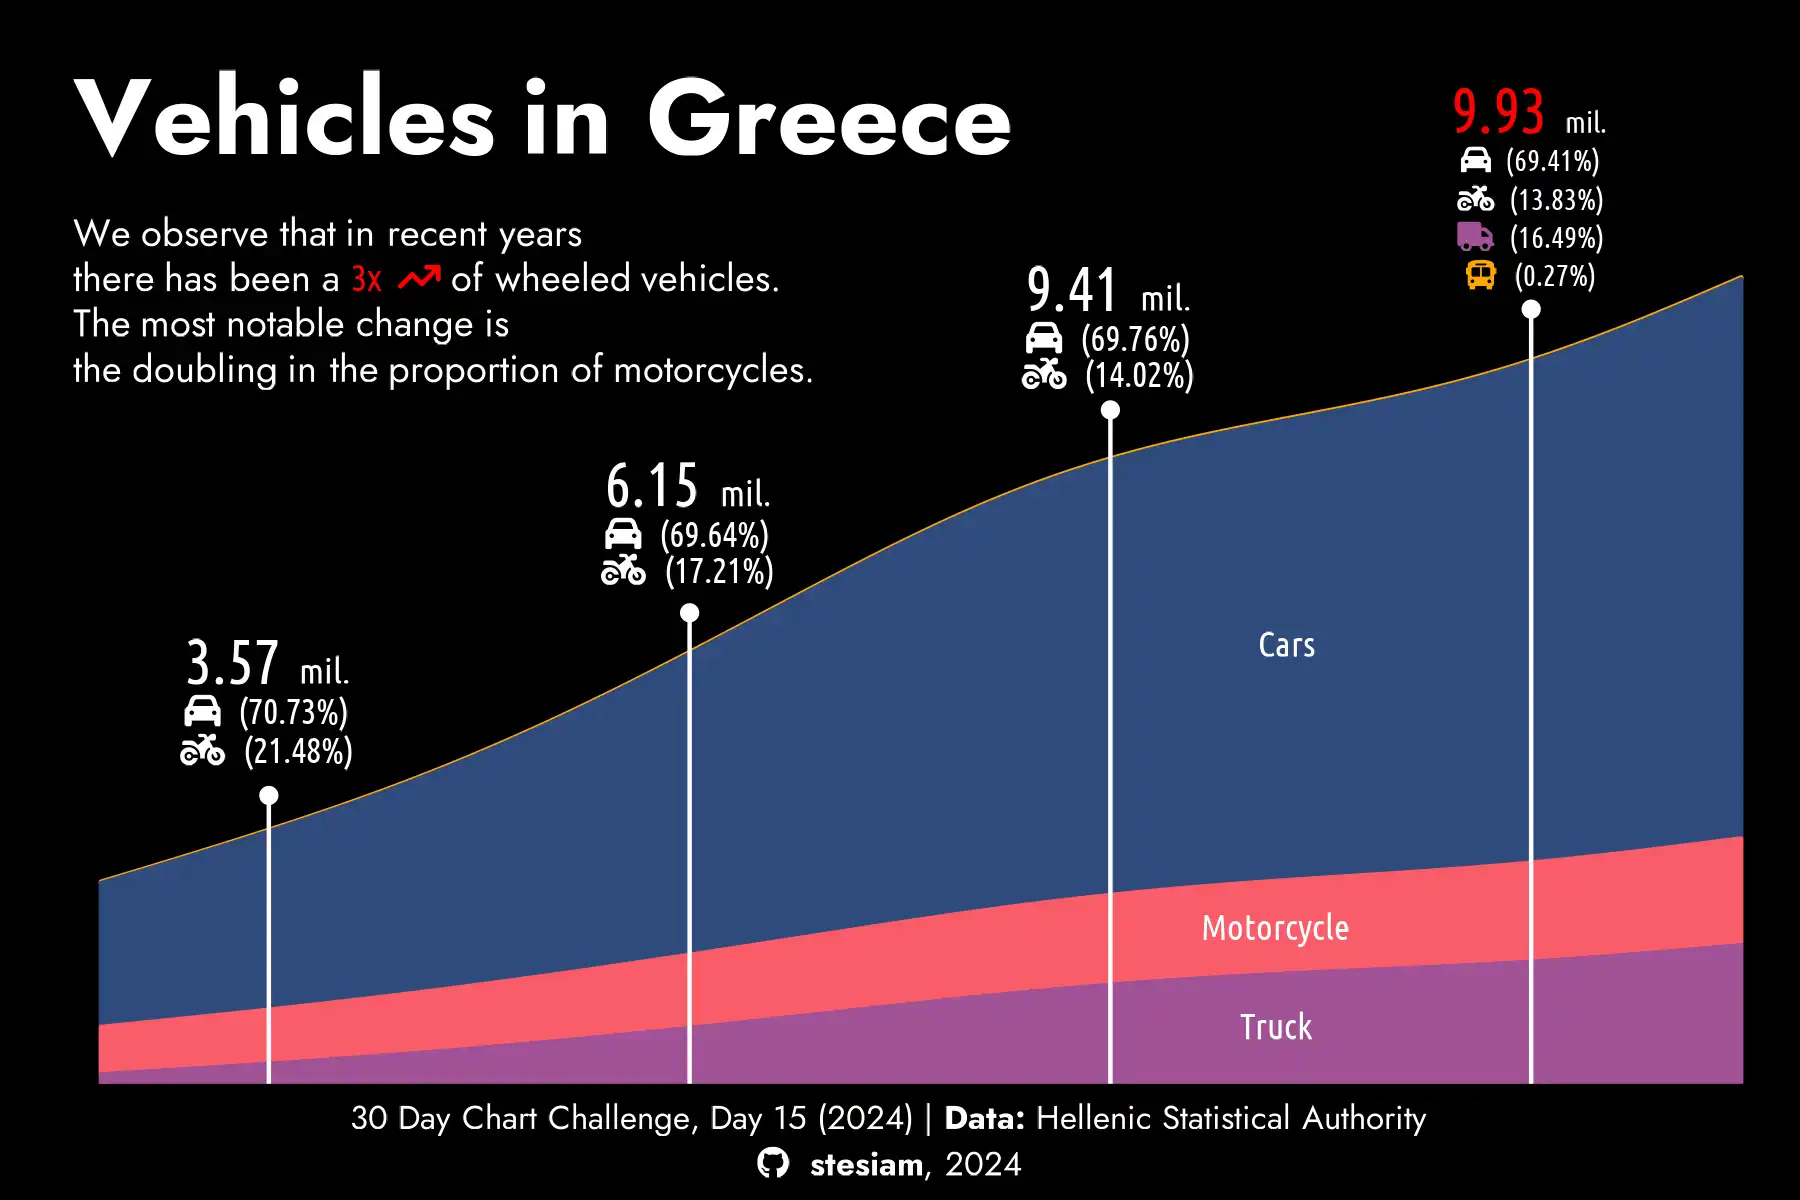
Vehicles in Greece, 30DayChartChallenge 2024, day 15 - October 2024
In Greek too
babelquarto is an R package that builds Quarto sites in more than one language. With it, the site also got a Greek version alongside the existing English one.
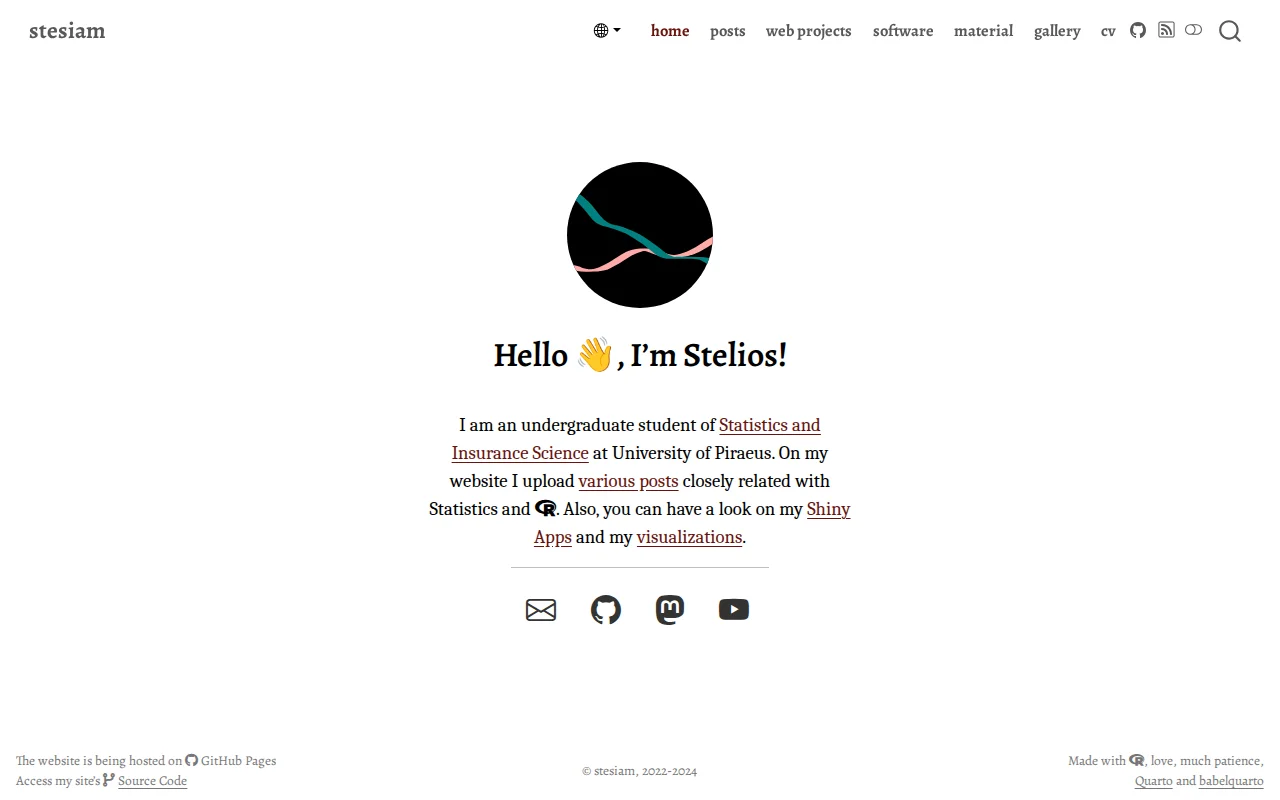
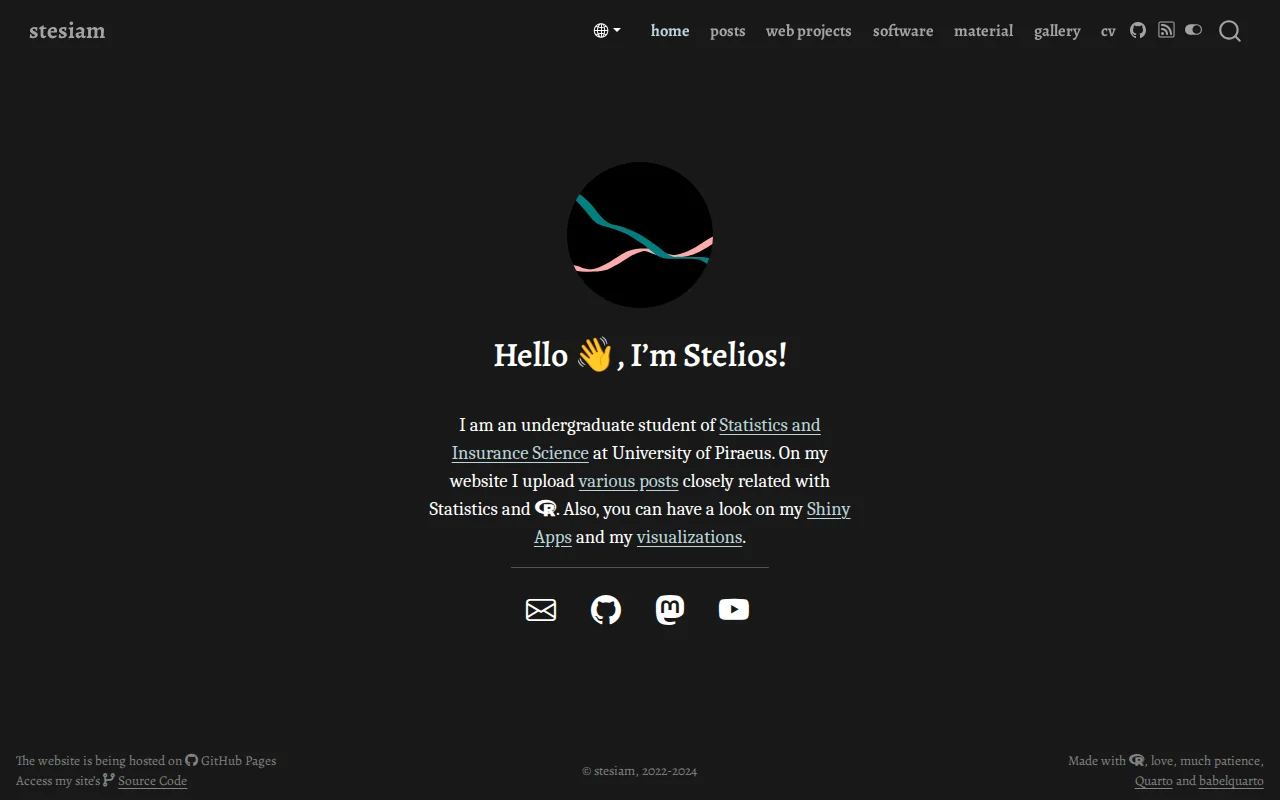
The home page, October 2024 - June 2025
Finally, a degree
After years of hassle, and even though they never gave me an A38 certificate, I got a copy of my degree, a certificate of completion and a (crumpled) diploma scroll.
- May 2026
A new site with Astro
I rebuilt the site from scratch with Astro, a tool for static websites. It gained search, comments and interactive charts, and remained bilingual.
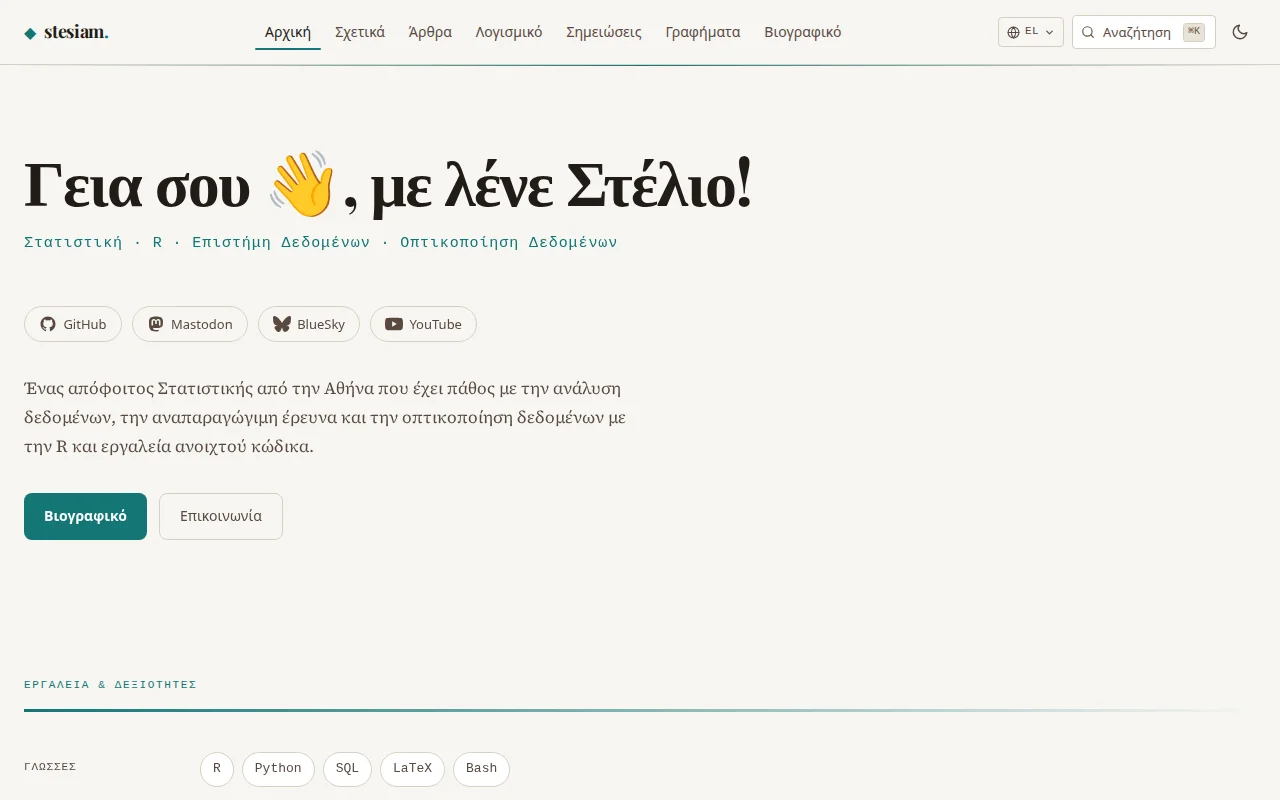
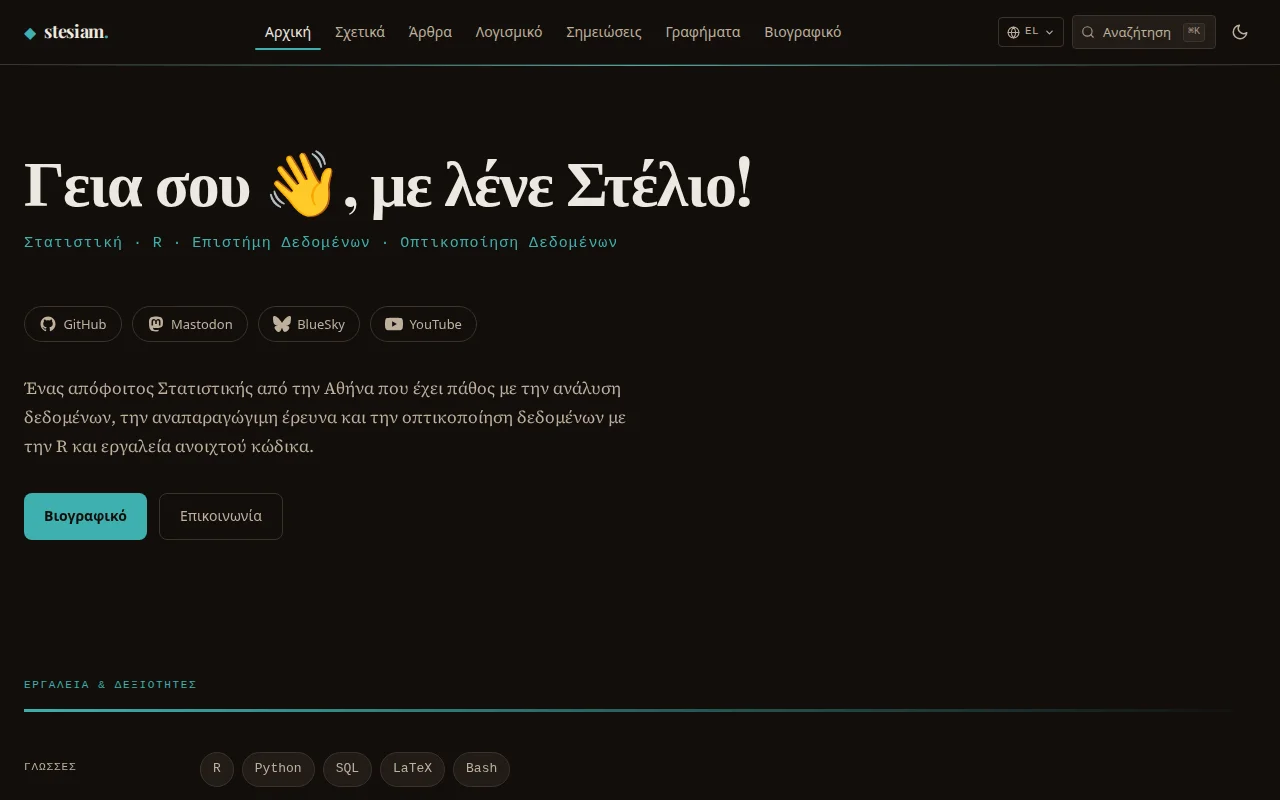
The home page, May 2026 - May 2026
From GitHub Pages to Cloudflare
The site stays static (no server needed), and its hosting moves from the (free) GitHub Pages plan to the free plans of Cloudflare Pages and then Cloudflare Workers.
- October 2026
Today’s design
Hard lines, square corners, a yellow highlighter.
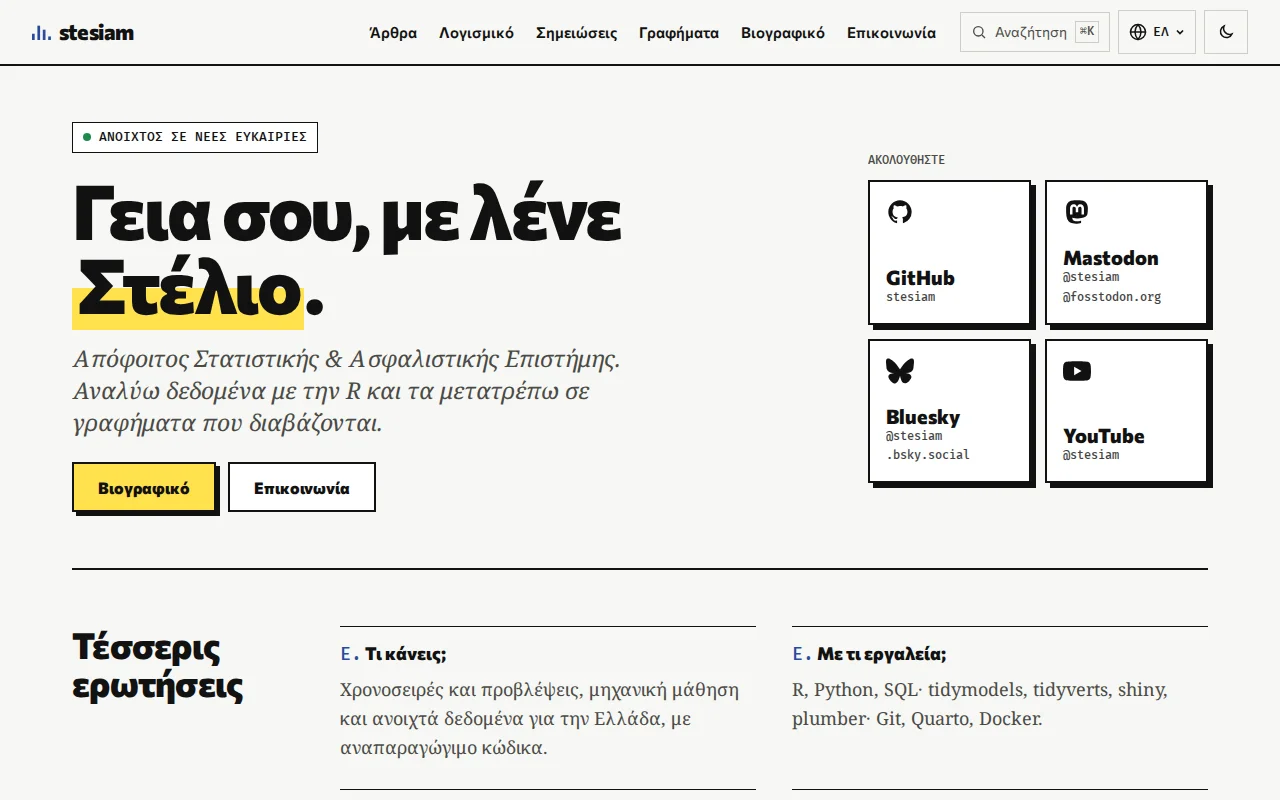
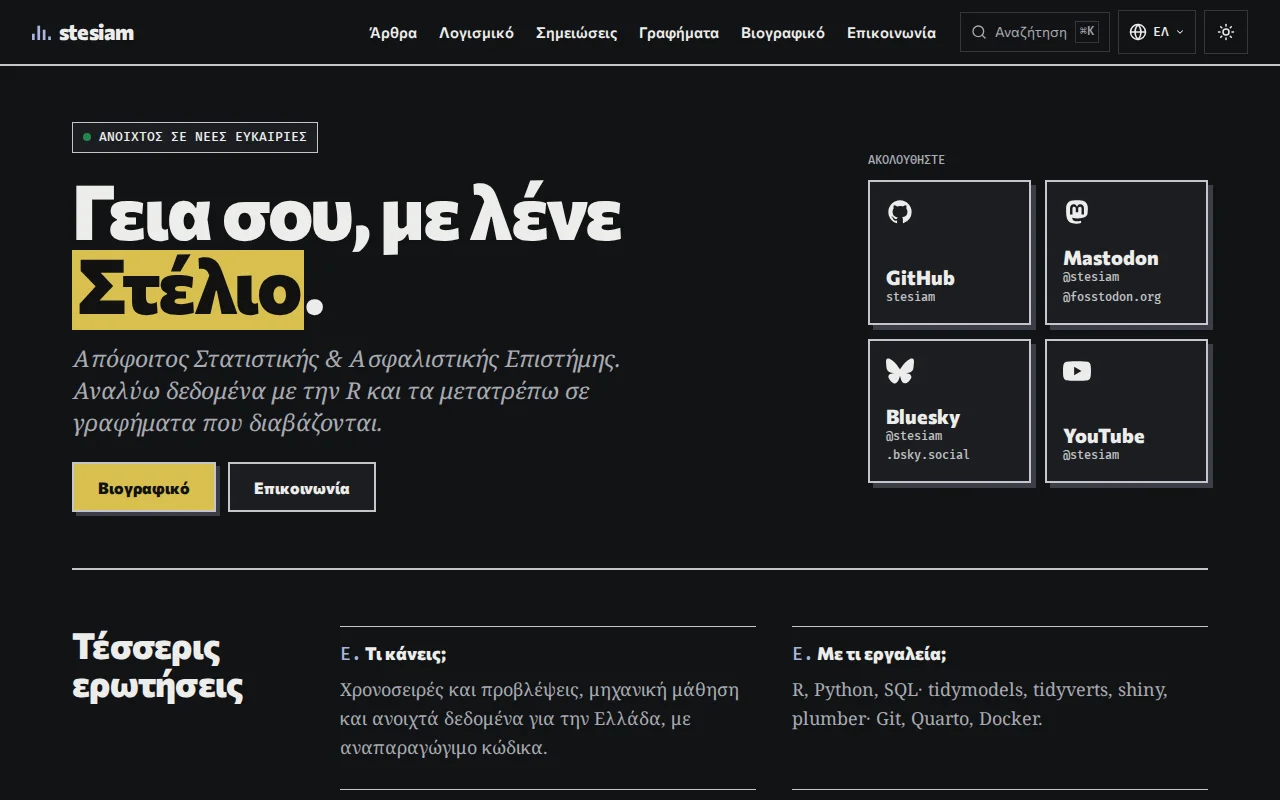
The home page, October 2026
Website Technologies
The frontend stack that builds and serves this site.
- What is the site made with?
- Astro Static website generation
- Which fonts are used?
- Commissioner Headings & interfaceNoto Serif Body textFira Mono Labels & code
- How is it made bilingual?
- Paraglide i18n - Greek & English
- How does search work?
- Pagefind Client-side full-text search
- What are the charts drawn with?
- Highcharts Interactive charts (non-commercial)D3.js Data visualisation with SVG
- How are formulas displayed?
- Temml Math formulas (LaTeX) in MathML
- Where are the site and its code hosted?
- Cloudflare Workers Site hostingGitHub Site repository
R Packages
The R packages I use to produce the analyses and charts featured across the site.
- How do I clean the data?
- dplyr Data transformation and filteringtidyr Data reshapingstringr String manipulation
- What do I make the static charts with?
- ggplot2 Static charts with grammar of graphics
- What do I train models with?
- tidymodels Modelling and ML frameworktidyverts Time series analysis and forecasting